

Reports
This view can look different dependent on your user role.
See Visibility and permissions for details.
See Visibility and permissions for details.
Advanced reporting is available on the Standard and Enterprise plans. See plans.
Open in TWICE Admin
reports
Primary purpose
Reports gives you 70+ built-in reports organized across six categories. Each report includes score cards, charts, and a data table you can filter by date range, location, and comparison period.Sales (36 reports)
Sales (36 reports)
Track revenue, average order value, gross profit, and sales breakdown by listing, location, channel, customer, and currency. Includes dedicated views for subscriptions, bookings, discount codes, and weekly sales patterns.
Orders (12 reports)
Orders (12 reports)
Monitor order volume over time, fulfilled orders, return rates, and returns by listing. View orders grouped by status and purchase type, track average booking duration, and see upcoming returns for proactive inventory planning.
Customers (9 reports)
Customers (9 reports)
Analyze new customer registrations, returning customer rate, and customer lifetime value. Segment customers by country and location, and compare new versus returning customer sales contribution.
Finances (8 reports)
Finances (8 reports)
Accrual-basis Revenue report and cash-basis Payments report with deferred revenue tracking, reconciliation bridge, and CSV export. Also includes payment volumes over time, breakdowns by gateway and method, payment fees, and per-order payment details.
Inventory (7 reports)
Inventory (7 reports)
Monitor stock levels by status, inventory value per stock item, daily items sold, and sell-through rate. Analyze per-stock-item utilization including order count and revenue generated.
Integrations (1 report)
Integrations (1 report)
View website analytics data from connected third-party sources.
Report Features
Every report shares a common set of tools for analysis and comparison.Date Range & Comparison
Date Range & Comparison
Filter any report by date range using presets (last 7, 30, or 90 days, last week, last month, last year) or a custom range. Compare against the previous period or previous year to spot trends.The page URL carries the date range, comparison period and locations you pick, so a filtered report survives a reload, a bookmark, or a link sent to a colleague. Only the selections that differ from the defaults appear in the URL.
Visualizations
Visualizations
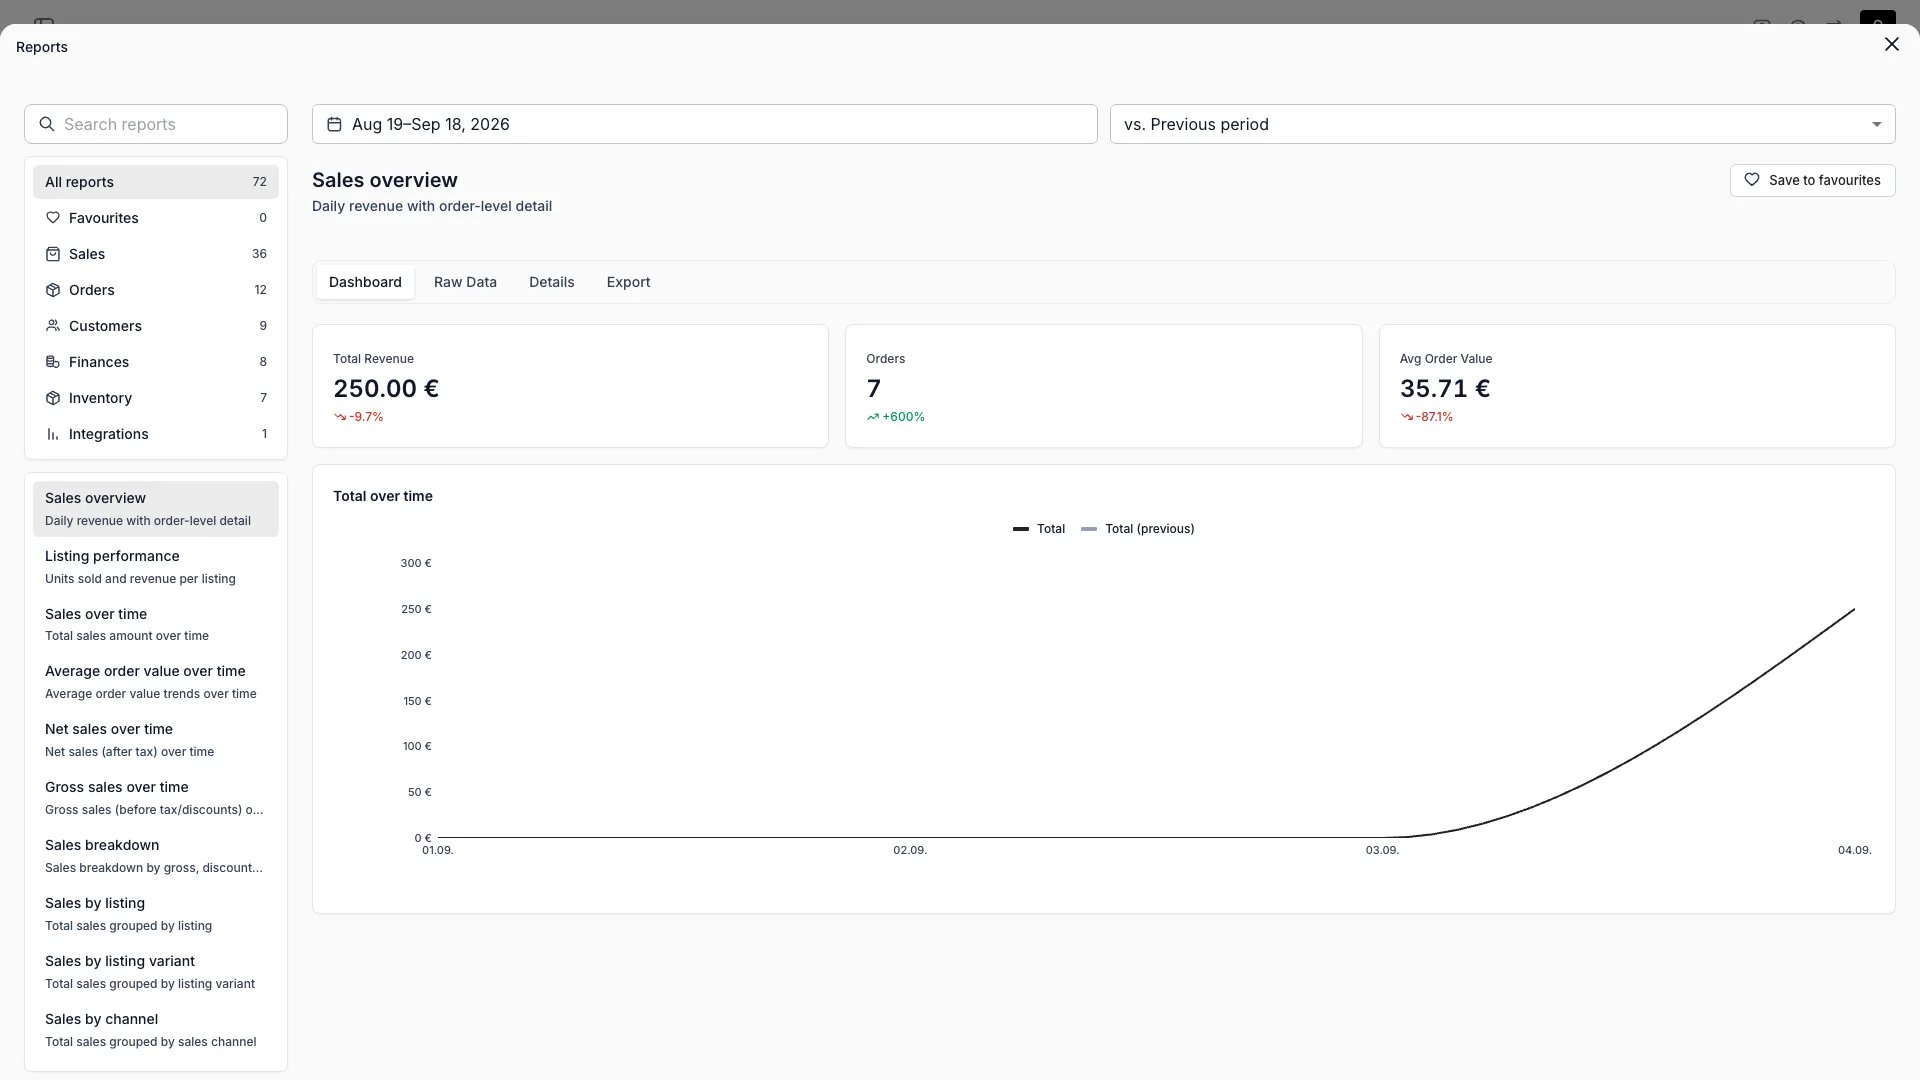
Reports display data as line charts, bar charts, horizontal bar charts, or donut charts depending on the metric. Each report also includes a full data table beneath the chart.
Score Cards
Score Cards
Summary metrics appear at the top of each report showing key values (revenue, count, percentage, or duration) with percentage change indicators compared to the selected comparison period.
Search & Favorites
Search & Favorites
Search across all your reports by name. Bookmark frequently used reports for quick access from the sidebar.
Location Filtering
Location Filtering
Filter report data by location to analyze performance across individual stores or warehouses. Search the list by name, or pick All locations to clear the filter and report on every one.
Anatomy of a report
Each report has four sub-views you can switch between.Dashboard
The default view: score cards at the top, primary chart, and quick filters. Best for at-a-glance trends and percentage changes.Reports > Sales overview > Dashboard
Raw data
The full data table behind the chart: every row, every column. Sortable, searchable, and filterable.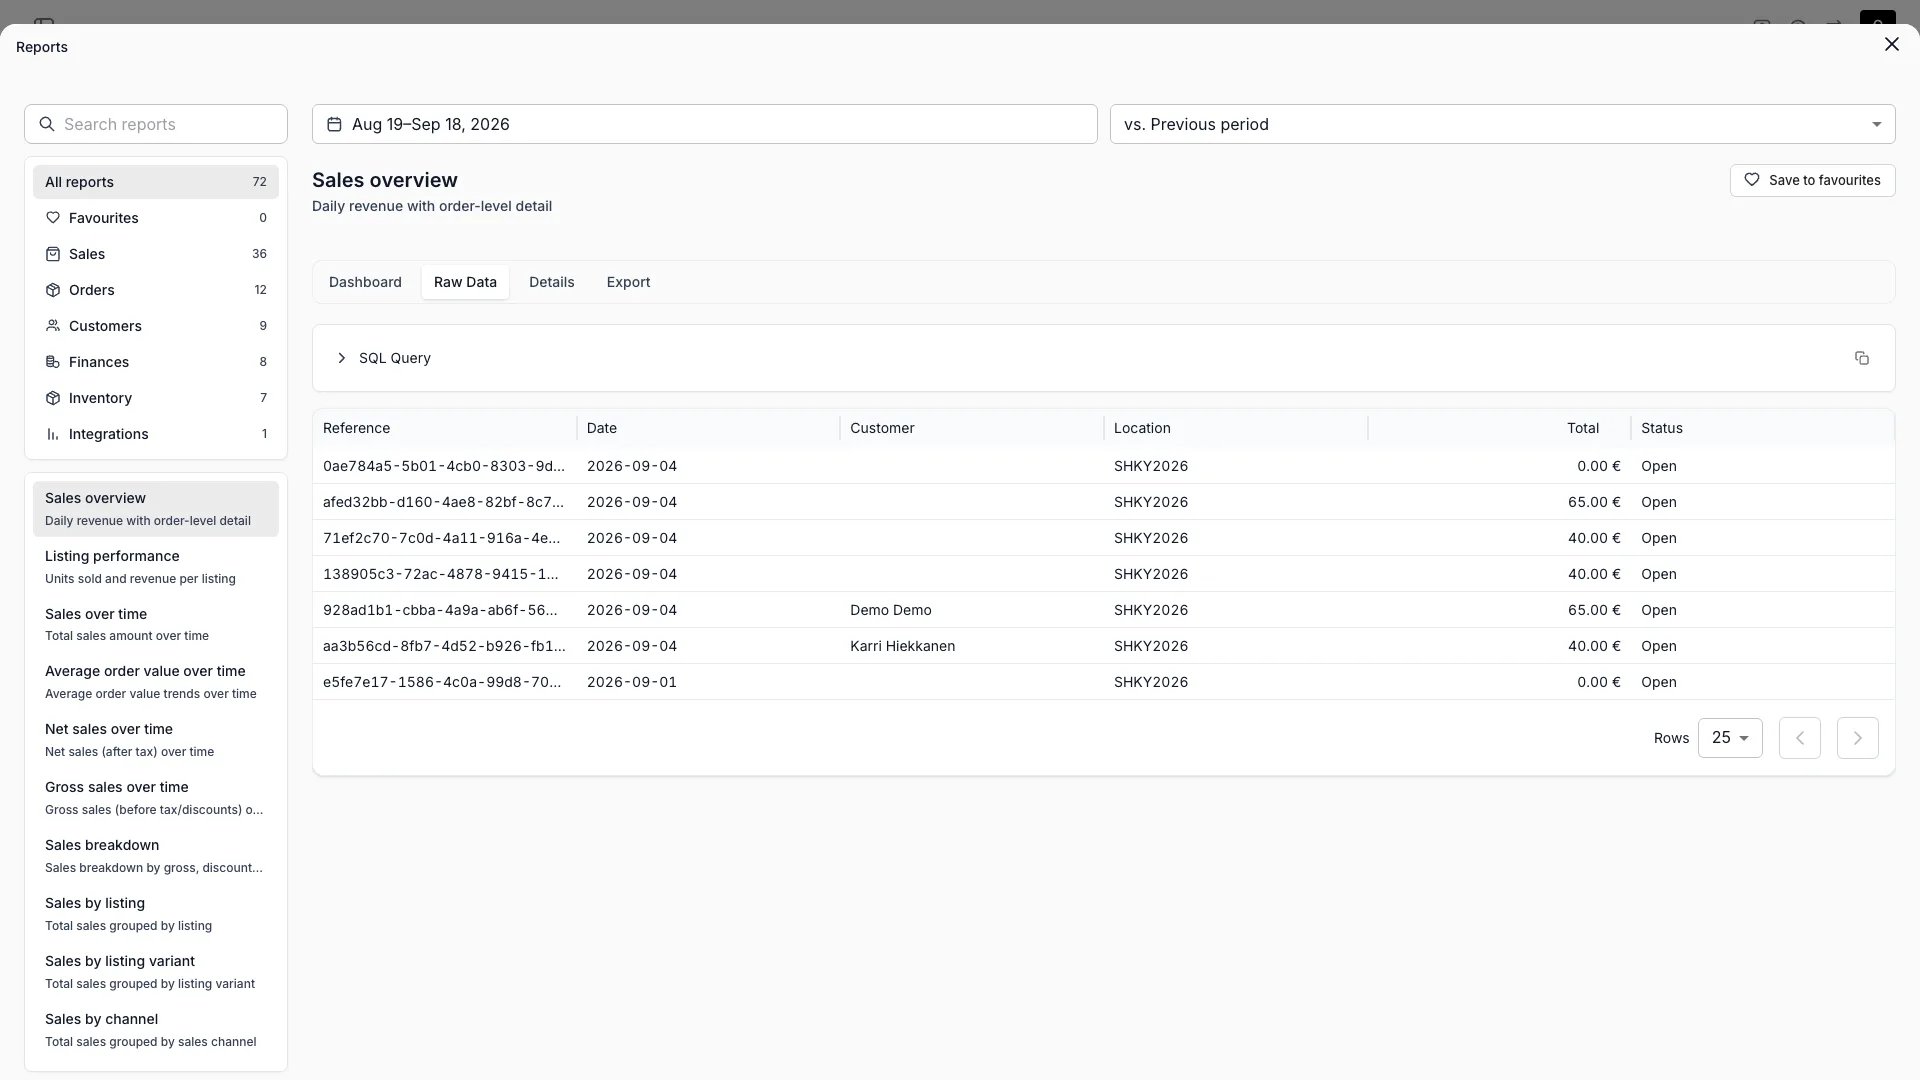
Reports > Sales overview > Raw Data
Details
Per-row drill-down showing the records that make up the aggregated values. Use it to verify numbers and find outliers.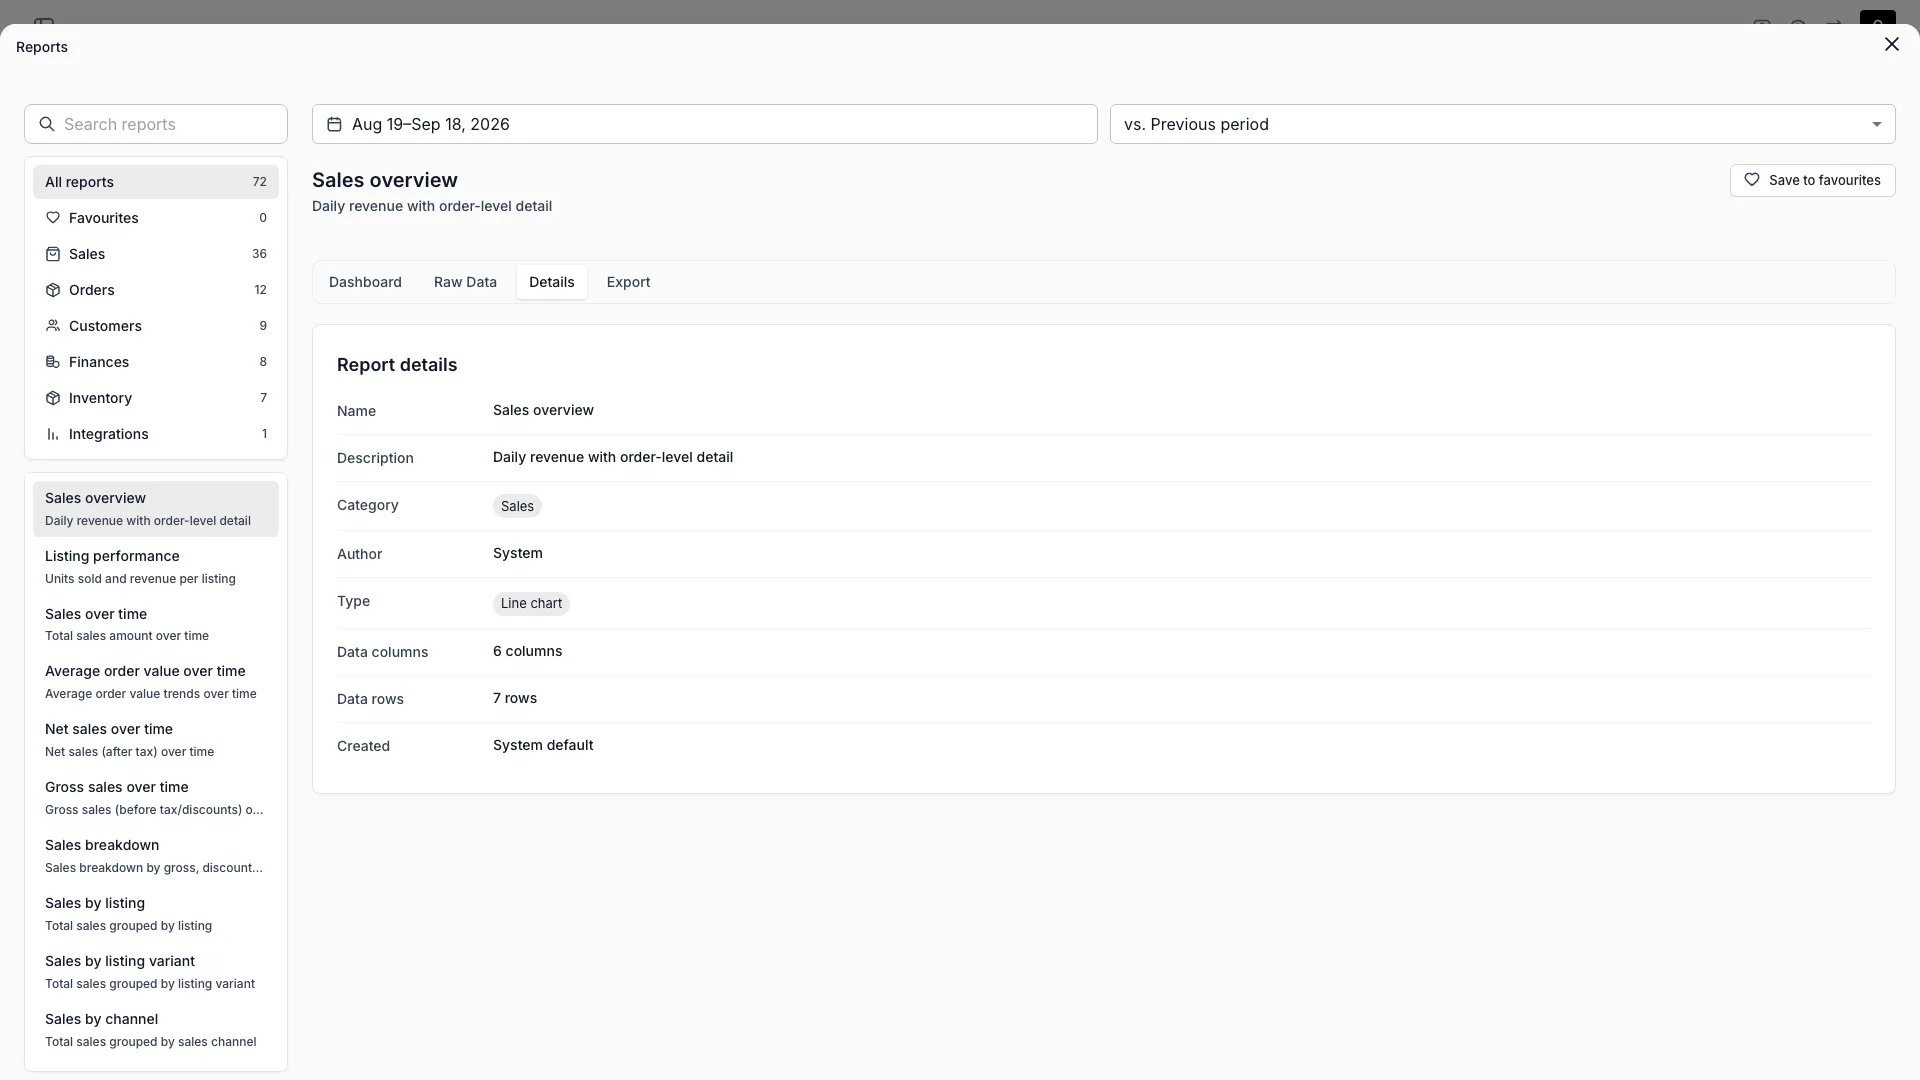
Reports > Sales overview > Details
Export
Export the report (current view, with active filters applied) as CSV. Exports can also be scheduled and emailed via Workflows.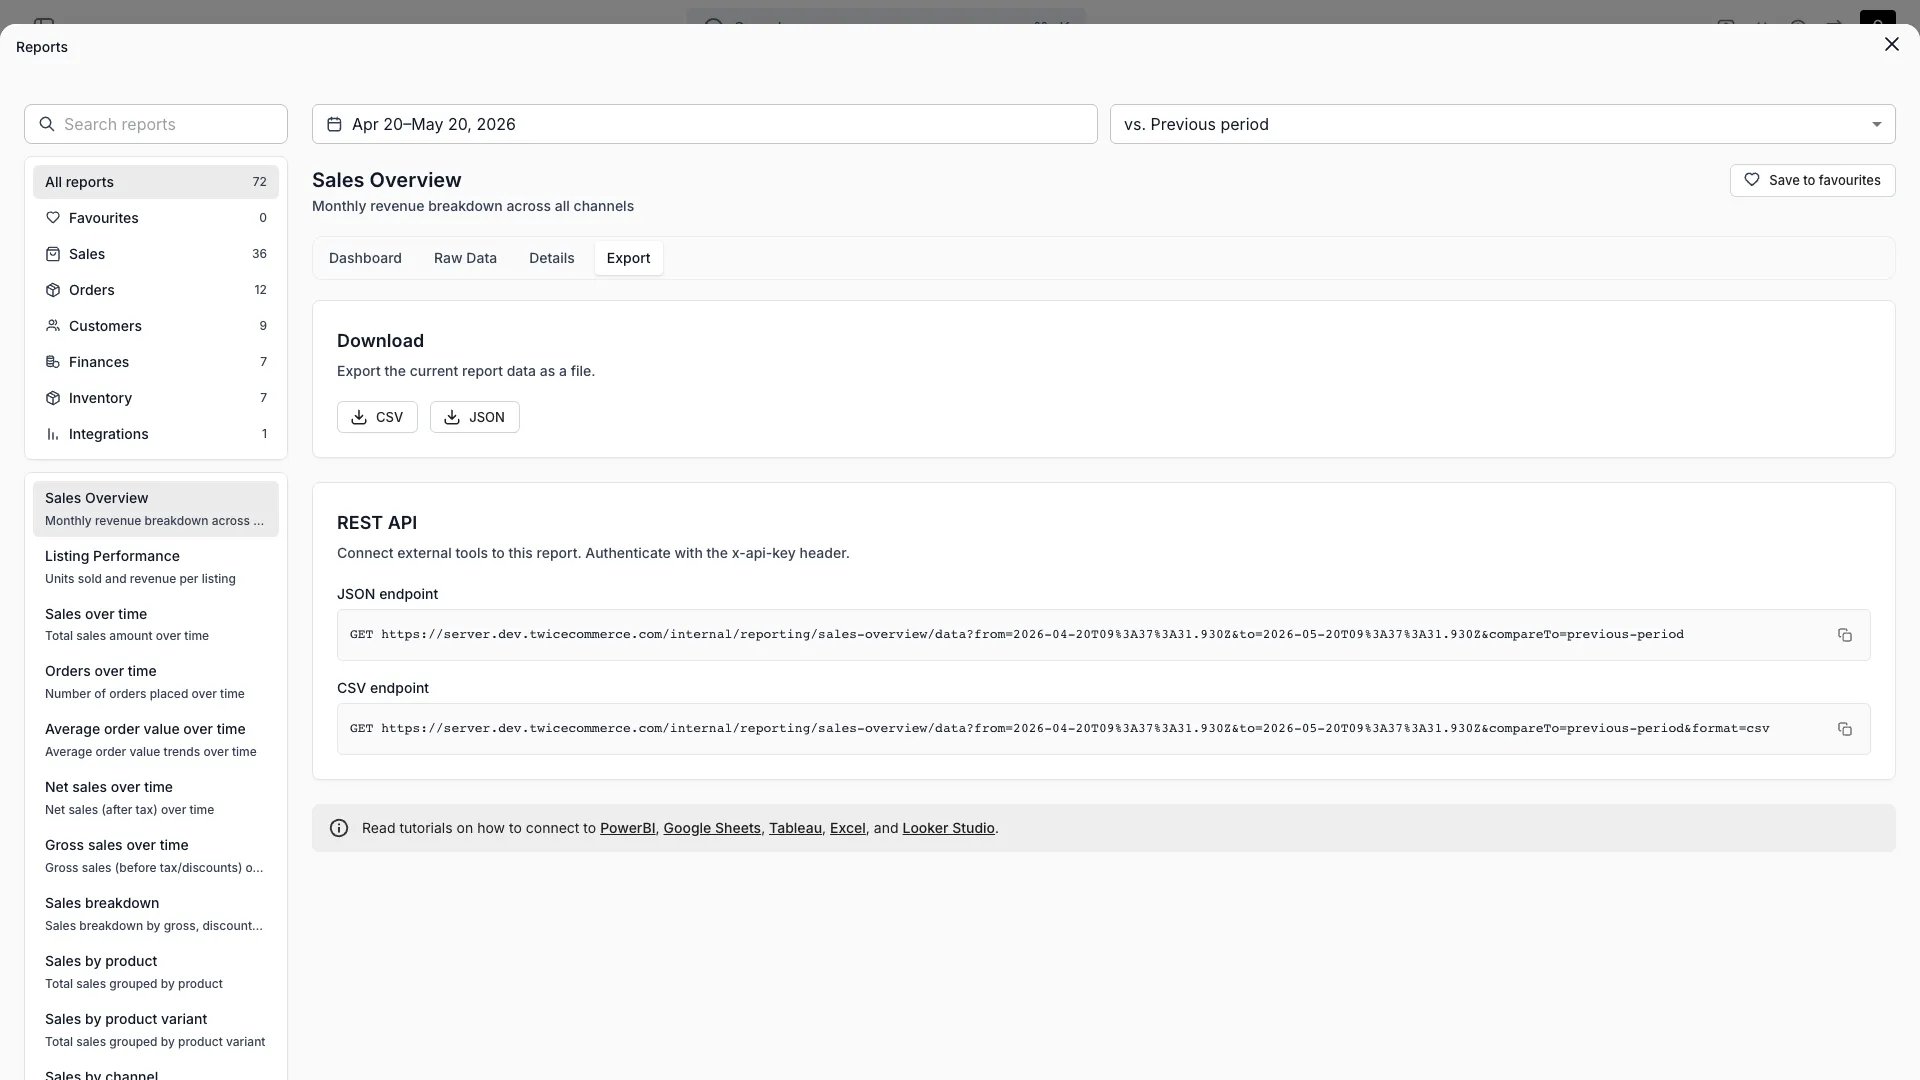
Reports > Sales overview > Export
Connect a report to an external tool
Open the report and set the date range, comparison period and locations you want, then switch to the Export tab. Copy the JSON endpoint URL from the REST API panel. The URL carries whichever filters are active on the report when you copy it. Authenticate the request with an API key in theX-API-KEY header.
Report data sits outside the versioned Admin API, so it has no page in the API tab and its URL can change without notice. Copy the URL from the Export tab instead of storing a hand-written path, and copy it again if a connection stops returning data.
Related concepts
Here are a few key concepts of TWICE Commerce that relate to Reports.Report Categories
Report Categories
Reports are organized into six categories (Sales, Orders, Customers, Finances, Inventory, and Integrations), each covering a different area of your business. The sidebar navigation groups reports by category for quick access.
Period Comparison
Period Comparison
Every report supports comparing the current date range against a previous period or the same period last year. Score cards show percentage change indicators so you can identify growth or decline at a glance.
Data Export
Data Export
Every report leaves TWICE with its active filters (date range, location, comparison period) applied. Download the rows as CSV or JSON from the Export tab, or point an external dashboard at the report’s JSON endpoint from the same tab.
Visibility and permissions
This view is gated byreports:sales_report, reports:tax_report, in the four operations: , , and .
Owner, Admin and Manager hold every operation. Member does not hold it at all.
For what each operation means and the full role matrix, see Users & Roles.
Related articles
Finance Reports
Revenue and Payments reports: accrual vs cash-basis analysis with reconciliation
Orders Overview
Manage all order types in one unified view
Inventory Overview
Track and manage all stock items in your inventory