

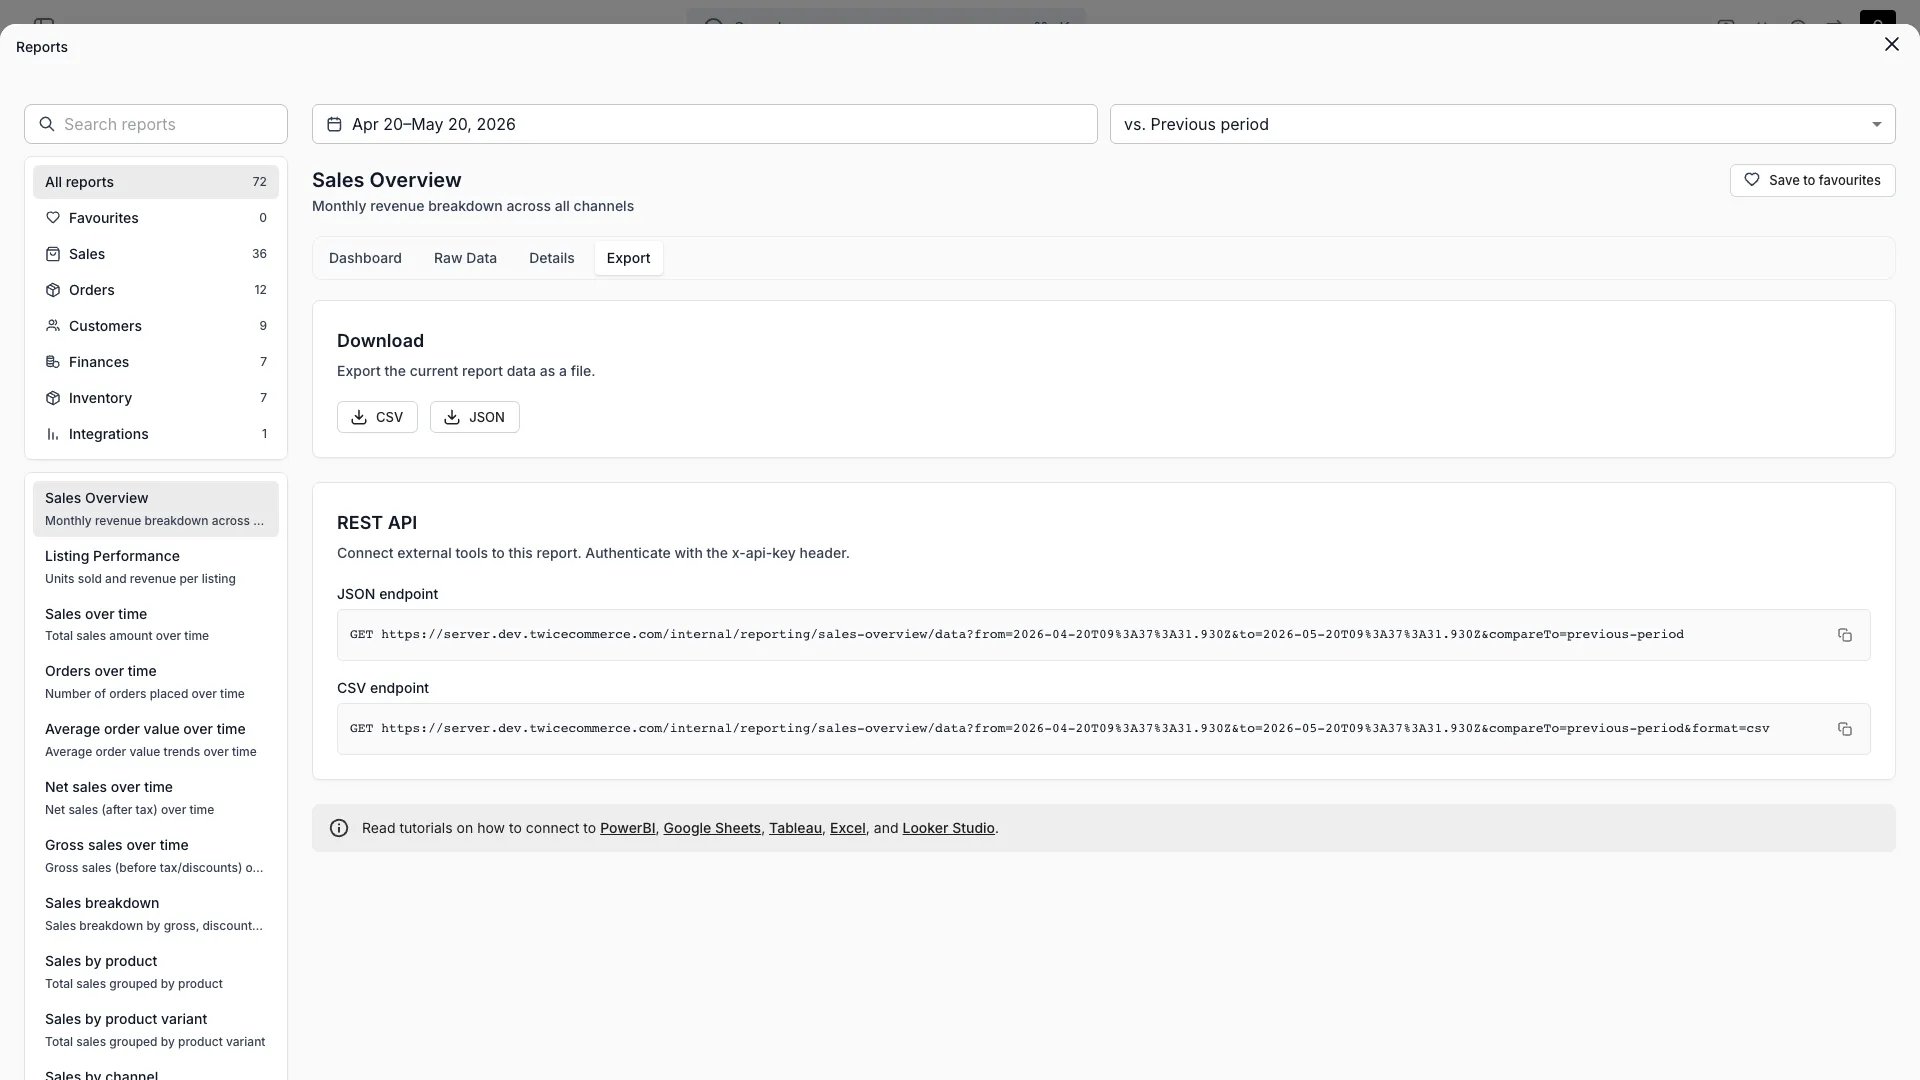
Reports > Sales overview > Export
Open in TWICE Admin
reports
Prerequisites
Decide before you start:
- The currency. Each ledger call returns one currency. Call once per currency you sell in.
- The history you need. One call returns up to 100,000 rows. Split a longer history into one call per year.
Advanced reporting is available on the Standard and Enterprise plans. See plans.
Pick the endpoint for the data you need
Use the two ledgers as the tables your model is built on. A built-in report returns the numbers one admin view shows, capped at 1,000 rows, so it suits a single chart and not a data model.
All paths go to
https://server.twicecommerce.com. Report data sits outside the versioned Admin API, so these paths have no page in the API tab and can change. Check this page if a connection stops returning data.
The walkthrough
1
Create an API key
Create a key under Settings → Integrations & API in the API keys section, and copy it. The full key is shown once.
2
Build the ledger URL
Add the period and the currency to the ledger path:
The dates are read in your account’s time zone, set under Account details. The ledger carries every location, so filter on its
Location column in your tool.3
Test the URL with the key
Send the key in the
X-API-KEY header. A working call returns the ledger as CSV.4
Connect your tool
Point your tool at the URL with the key in the header. Follow the guide for your tool: Power BI, Excel, Google Sheets, Tableau or Looker Studio.
Read the ledger files
Open the file you saved in the test and check it starts like this:Revenue ledger, first rows
Read amounts in the currency’s main unit. Refunds and platform fees are negative, so sum
Amount_Total for net revenue or net proceeds.
The number of tax columns follows the tax rates used in the period: Tax_Rate_1 and Tax_Amount_1, then _2, and so on. A period with a new rate adds a column. Refer to columns by name, never by position.
Finance reports describes every column, and which date column to sum for sold, delivered and returned revenue.
Build a data model from the ledgers
Load the two ledgers as fact tables and join them on the revenue key:
Group orders on
Order_ID, and locations on Location and Cost_Center. Platform fees and payments with no order line have an empty Revenue_Row_ID, so keep the join a left join from payments.
Row_ID is stable across calls. Use it to de-duplicate when two calls cover overlapping periods.
Read a built-in report instead
Copy the JSON endpoint from the Export tab of any report, with the filters you want applied. The response carries the report’scolumns and rows:
currency hold minor units (cents): divide by 100 for euros. truncated: true means the report hit the 1,000-row cap, so narrow the dates or use a ledger.
For a built-in report as CSV, call /internal/reporting/reports/{reportId}/export with from and to. It returns the same rows in the ledger file format.
Stay inside the rate limits
Plan the refresh around the limits. A refresh that fires many calls at once hits them before the data does.
Keep one refresh to five export calls or fewer. Every call also counts against your API key’s allowance, described under API keys.
How do I know it worked?
- The test call saves a CSV whose first line starts
Create_Date;Start_Date;End_Date. - The sum of
Amount_TotalwhereStarted_In_PeriodisYesmatches the Revenue report in the admin for the same period, currency and Started in period recognition. - The last line of the file is a data row, not a message.
Troubleshooting / common pitfalls
The call returns 400 Bad Request
The call returns 400 Bad Request
A required parameter is missing or malformed. The ledgers need
from, to and currency, and the dates must be plain YYYY-MM-DD without a time.The last line reads "Export truncated at 100,000 rows"
The last line reads "Export truncated at 100,000 rows"
The period holds more rows than one call returns. Split the period, for example one call per year, and append the results.
Row_ID keeps the appended table free of duplicates.The call returns 429 Too Many Requests
The call returns 429 Too Many Requests
The refresh made too many calls in one minute. Wait the number of seconds in the
Retry-After header, then cut the number of export calls per refresh to five or fewer.The CSV endpoint on the Export tab returns JSON
The CSV endpoint on the Export tab returns JSON
The CSV endpoint shown on a report’s Export tab returns the same JSON as the JSON endpoint. Replace
/data in the path with /export and drop the compareTo parameter to get CSV.The totals are 100 times too large
The totals are 100 times too large
The data comes from a built-in report’s JSON endpoint, which returns money in cents. Divide
currency columns by 100. The ledger files are already in euros.A column disappeared or a new one appeared
A column disappeared or a new one appeared
The tax columns follow the tax rates used in the period. Refer to columns by name, and treat
Tax_Rate_n and Tax_Amount_n as optional.Related articles
Connect Power BI
Load the ledgers into Power BI and refresh them on a schedule.
Connect Google Sheets
Load the ledgers into a sheet with Apps Script.
Finance reports
Every column of the two ledgers, and how each number is derived.
API keys
Creating keys, and the rate limits every key shares.
Reports
Every built-in report and its Export tab.