

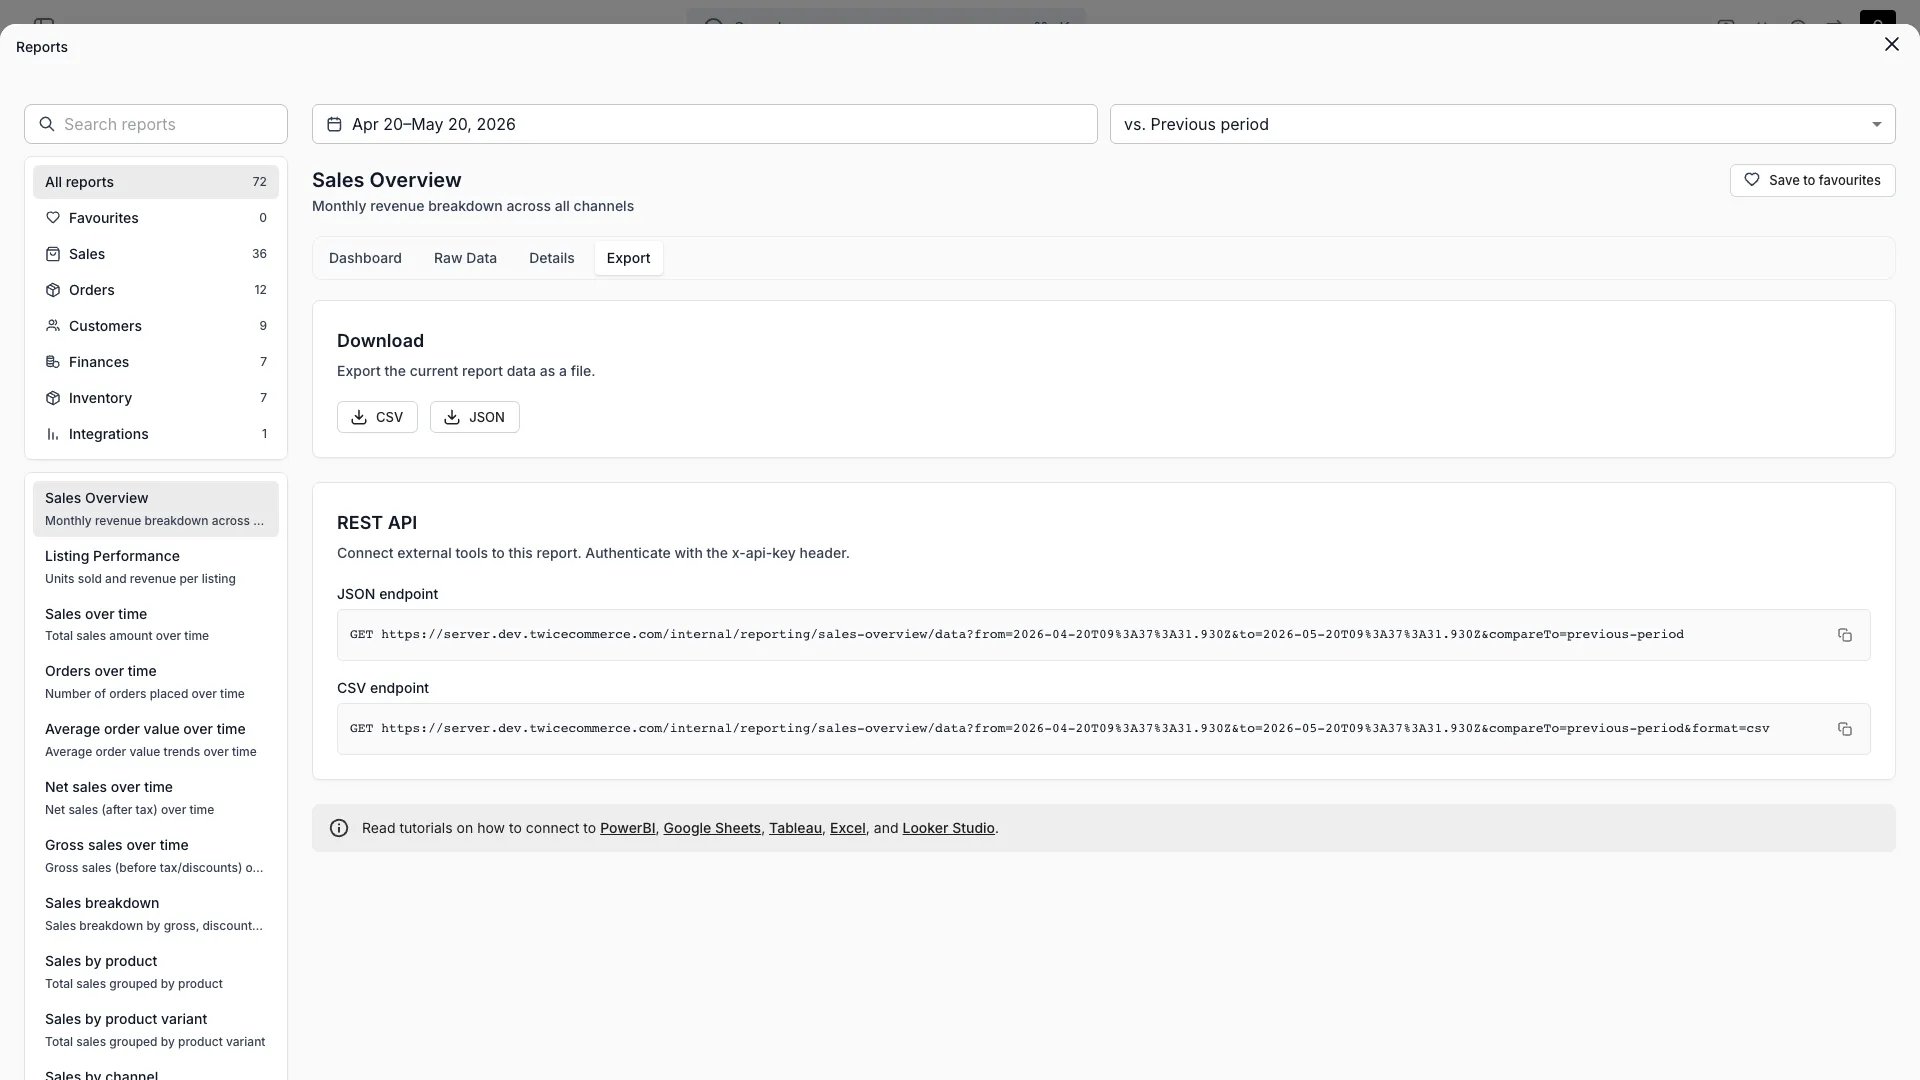
Reports > Sales overview > Export
Open in TWICE Admin
reports
Prerequisites
Before you start: set up the sheet in Connect Google Sheets and let the script run once, so the
Revenue and Payments tabs hold data.The walkthrough
1
Add the revenue tab as a data source
In Looker Studio, choose Create → Data source and pick the Google Sheets connector. Select your spreadsheet and the
Revenue worksheet, keep “Use first row as headers” on, and select Connect.2
Check the field types
Set
Create_Date, Start_Date and End_Date to Date, and every Amount_ field to Currency in your currency. Set Row_ID and Order_ID to Text.3
Add the payments tab
Repeat the two steps for the
Payments worksheet, with Payment_Date as Date.4
Blend when a chart needs both
Add a blend with
Payments on the left and Revenue on the right, joined as a left outer join on Revenue_Row_ID = Row_ID. Use the blend only where a chart needs fields from both ledgers.5
Set the data freshness
Open the data source, choose Data freshness, and set it to match the sheet’s trigger. A daily script needs no more than an hourly check.
How do I know it worked?
- A scorecard summing
Amount_Total, filtered toStarted_In_Period=Yes, matches the Revenue report in the admin for the same period and currency. - After the sheet’s next scheduled run, the dashboard shows the new rows without editing the data source.
Troubleshooting / common pitfalls
Amounts sum to zero or show as text
Amounts sum to zero or show as text
The field was detected as Text. Set it to Currency in the data source. If it keeps reverting, the sheet holds text in that column: check that the sheet’s script wrote numbers.
A field disappears after a refresh
A field disappears after a refresh
The tax columns follow the tax rates in the period, so
Tax_Rate_2 can come and go. Build charts on Amount_Excl_Tax and Amount_Total, and select Refresh fields on the data source when the tax columns change.The dashboard shows yesterday's numbers
The dashboard shows yesterday's numbers
The sheet refreshes only when its trigger runs. Run
refreshTwiceLedgers in Apps Script for a manual update, or add a second daily trigger.Related articles
Connect Google Sheets
The sheet this dashboard reads.
Pull your data into a BI tool
The endpoints, the file format and the data model.
Finance reports
Every ledger column, and how each number is derived.