

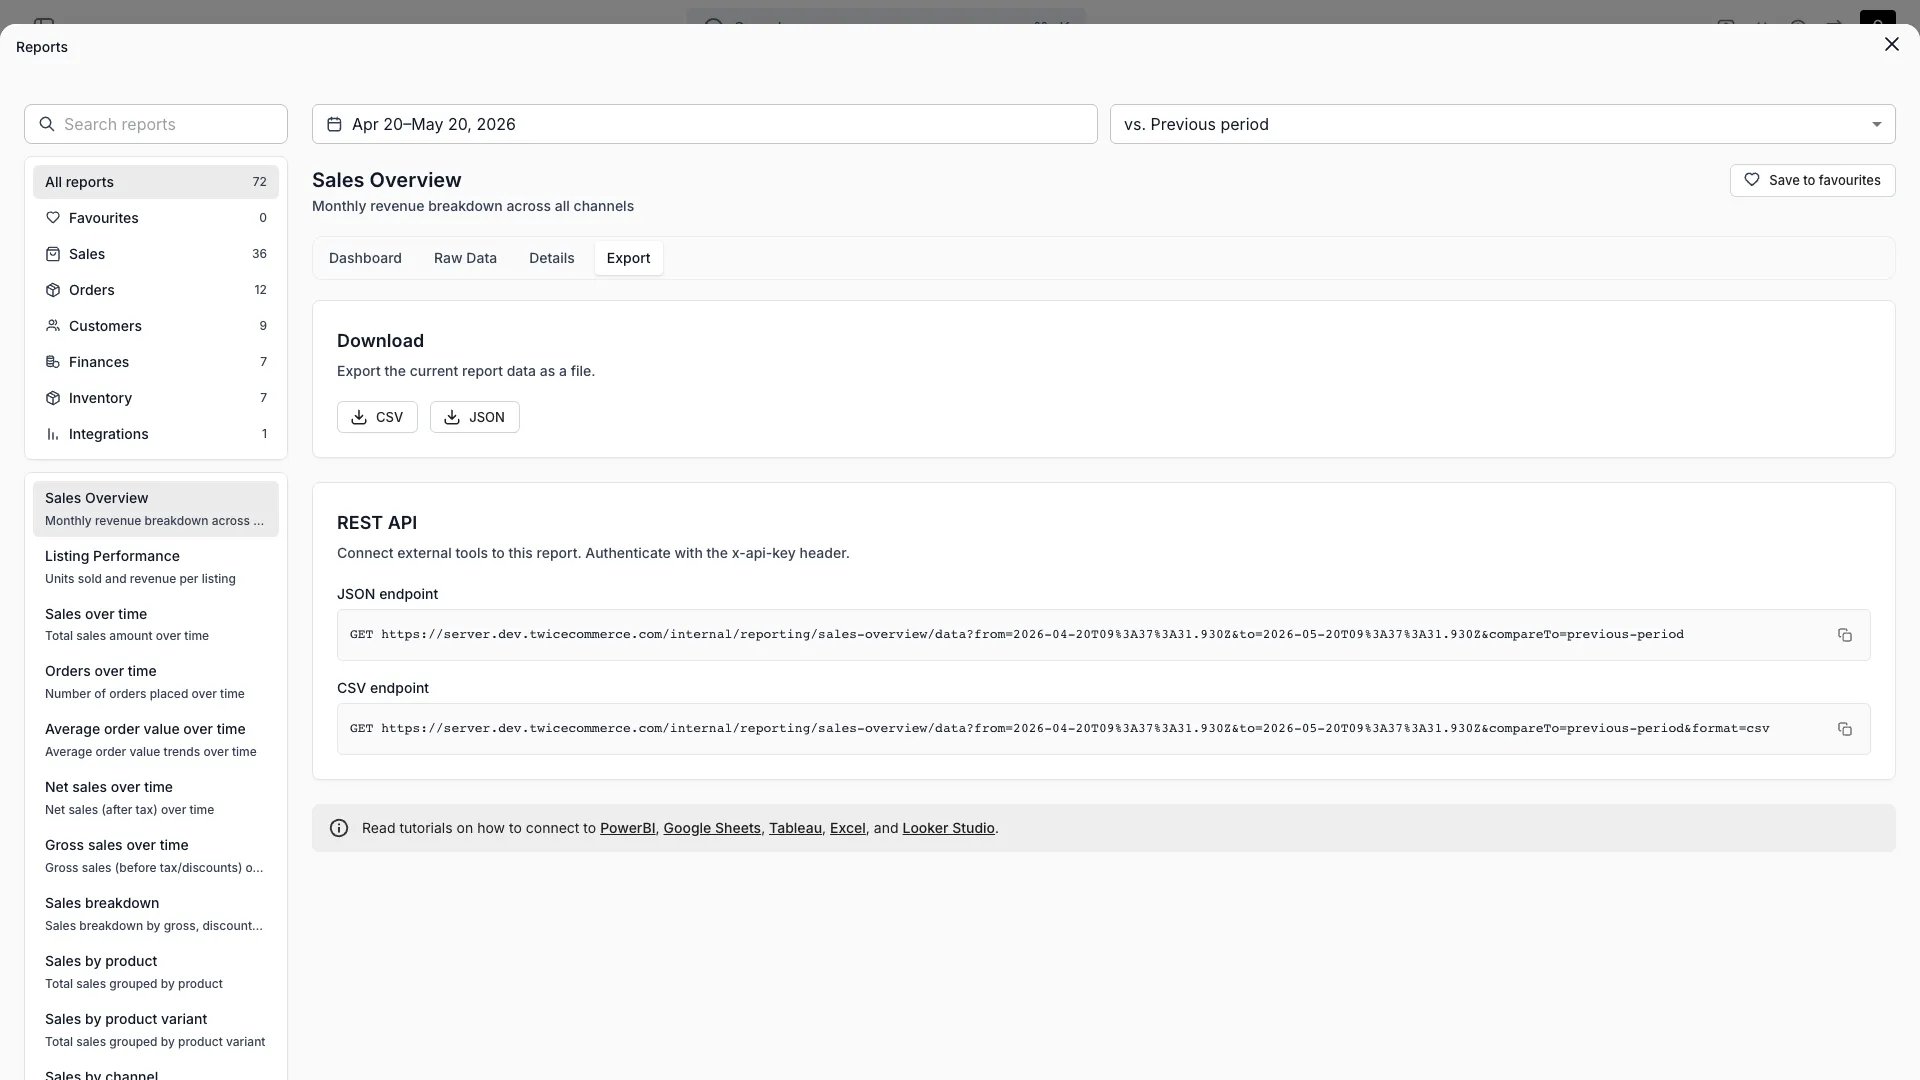
Reports > Sales overview > Export
Open in TWICE Admin
reports
IMPORTDATA cannot send the API key header.
Prerequisites
Before you start:
- The ledger endpoints and file format from Pull your data into a BI tool.
- Your currency code and the first date you want history from.
- A size check. A Google Sheet holds 10 million cells, and a ledger row is about 30 cells, so a sheet fits roughly 300,000 ledger rows across both tabs.
The walkthrough
1
Open the script editor
Create a Google Sheet, then choose Extensions → Apps Script.
2
Store the key as a script property
Open Project Settings (the gear icon), select Add script property, set Property to
TWICE_API_KEY and Value to the key, and save.3
Paste the script
Open Editor, replace the contents of
Code.gs with the script below, and change CURRENCY and FROM_DATE to yours. Save.4
Run it once
Select
refreshTwiceLedgers in the function menu and choose Run. Approve the permissions Google asks for: the script reads the sheet and calls an external URL.5
Schedule it
Open Triggers (the clock icon) and choose Add Trigger. Pick
refreshTwiceLedgers, set the event source to Time-driven, pick Day timer and an hour, and save.FROM_DATE to today. Point formulas, pivot tables and charts at the tabs, never at a fixed range, because the row count grows.
How do I know it worked?
- The sheet has a
Revenuetab and aPaymentstab, each starting with a header row. - A pivot table on the
Revenuetab summingAmount_Total, filtered toStarted_In_Period=Yes, matches the Revenue report in the admin for the same period and currency. - Executions in the Apps Script editor lists a completed run started by the trigger.
Troubleshooting / common pitfalls
The run fails with "export failed with 401"
The run fails with "export failed with 401"
The script property is missing or holds an old key. Check
TWICE_API_KEY under Project Settings, and that the key still exists under Settings → Integrations & API in TWICE Commerce.The run fails with "export was truncated"
The run fails with "export was truncated"
The period holds more than 100,000 rows. Move
FROM_DATE later, or load one tab per year by calling loadLedger_ once per year with its own dates and sheet name.The run fails with "Exceeded maximum execution time"
The run fails with "Exceeded maximum execution time"
One run may take six minutes. Load the revenue and payments ledgers from two functions on two triggers an hour apart.
Dates or amounts show as text
Dates or amounts show as text
A formula or format on the tab was set before the load. Clear the tab’s formatting and let the script write the values again.
Related articles
Pull your data into a BI tool
The endpoints, the file format and the rate limits.
Connect Looker Studio
Build dashboards on this sheet.
Connect Tableau
Point Tableau at this sheet.
Finance reports
Every ledger column, and how each number is derived.