

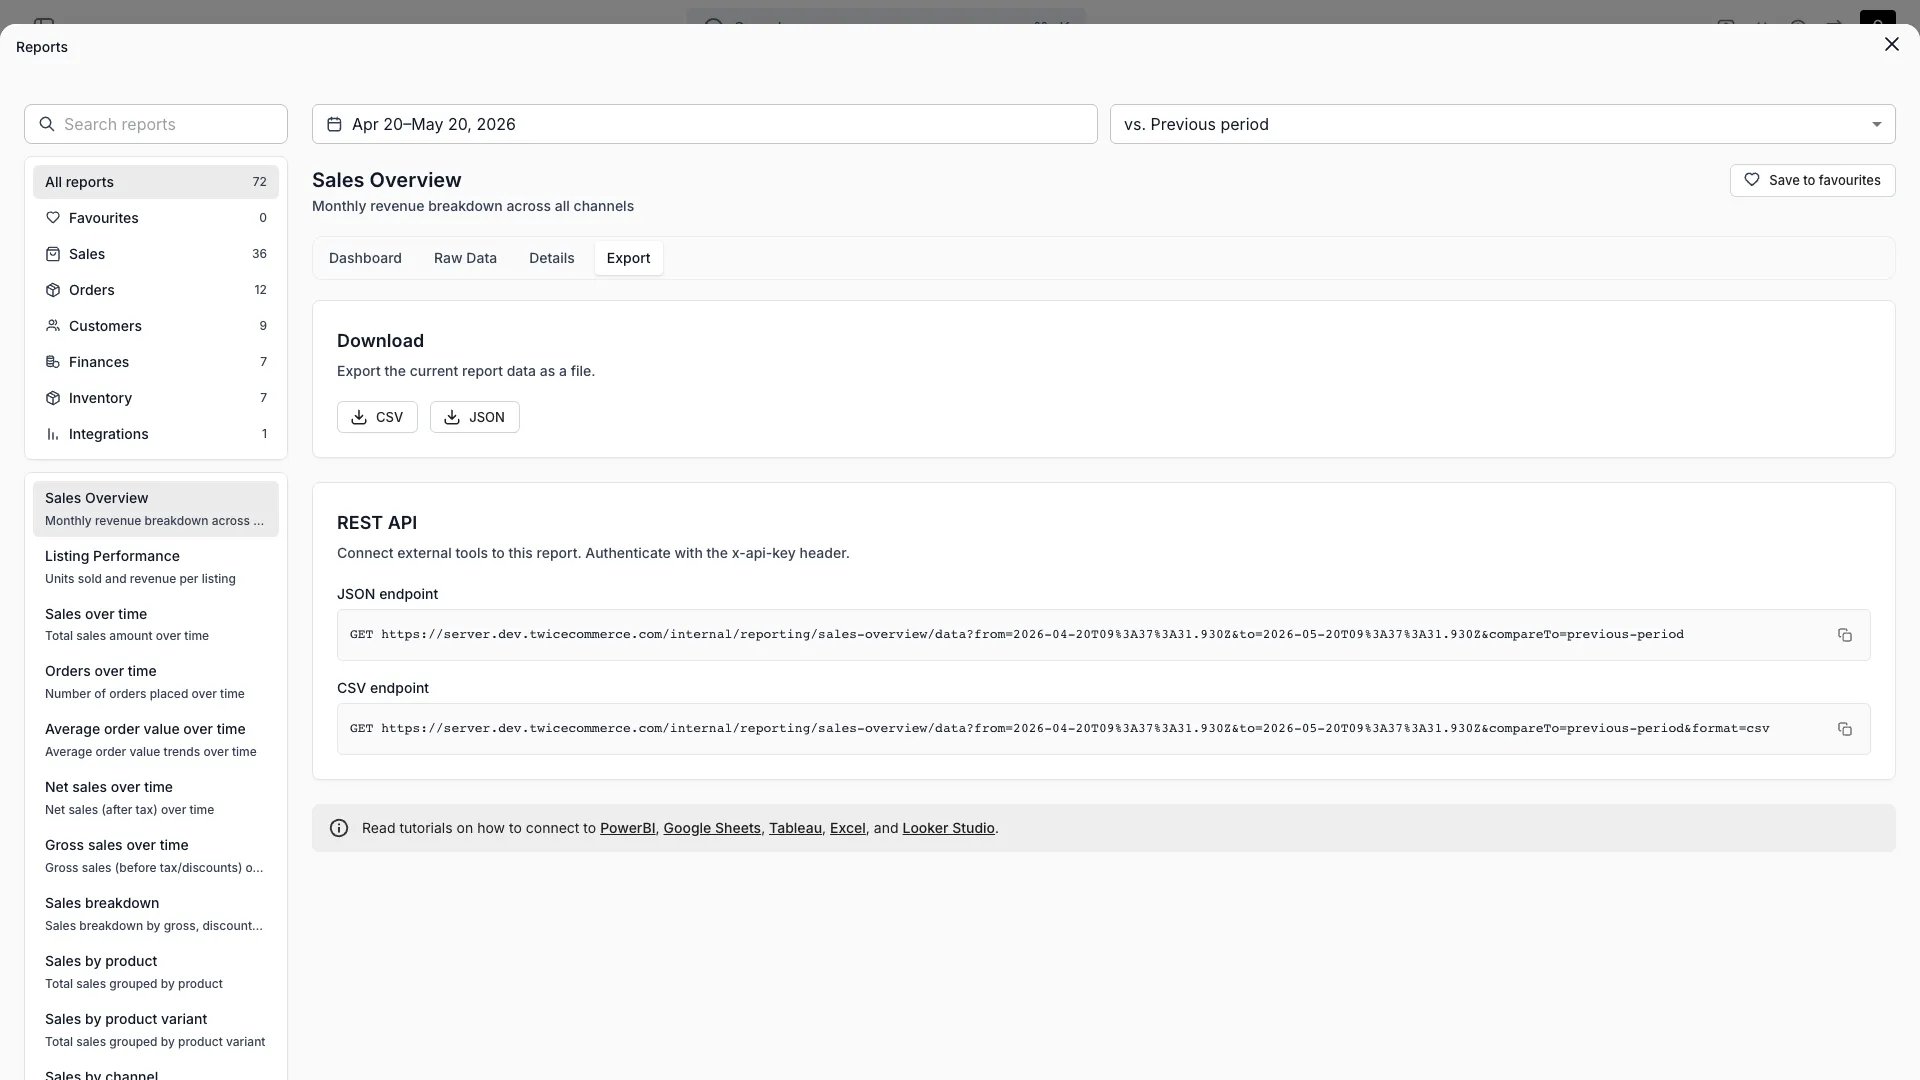
Reports > Sales overview > Export
Open in TWICE Admin
reports
Prerequisites
Before you start:
- Excel for Microsoft 365 on Windows. These steps use its Power Query editor.
- The ledger endpoints and file format from Pull your data into a BI tool.
- Your currency code and the first date you want history from.
The walkthrough
1
Open a blank query
Choose Data → Get Data → From Other Sources → Blank Query. The Power Query editor opens.
2
Store the key in a parameter
Choose Home → Manage Parameters → New Parameter, name it
TwiceApiKey, set Type to Text, and paste the key into Current Value.3
Paste the revenue ledger query
Select the blank query, open Advanced Editor, and replace its contents with the query below. Change
currency and FromDate to yours. Rename the query Revenue.4
Connect anonymously
Choose Edit Credentials when Power Query asks how to connect, pick Anonymous, and select Connect. The key travels in the header.
5
Add the payments ledger query
Duplicate the
Revenue query, rename the copy Payments, and change RelativePath to internal/reporting/payments/export. Replace the typed columns with Payment_Date as type date and Amount_Total as type number.6
Load the tables
Choose Home → Close & Load. Each query lands on its own sheet as an Excel table.
7
Refresh on open
Right-click the
Revenue query in Queries & Connections, choose Properties, and tick “Refresh data when opening the file”. Repeat for Payments."en-US" culture reads 202.42 as a number on a computer set to a comma-decimal locale, such as Finnish. The tax columns are left untyped, because their number follows the tax rates in the period.
An Excel table holds about a million rows. For a longer history than one call returns, use the yearly query in Connect Power BI, which runs unchanged in Excel.
How do I know it worked?
- The
Revenuesheet shows one row per order line, andAmount_Totalis right-aligned as a number. - A pivot table summing
Amount_Totalfiltered toStarted_In_Period=Yesmatches the Revenue report in the admin for the same period and currency. - Data → Refresh All finishes without an error.
Troubleshooting / common pitfalls
Amounts load as text, or as 20242 instead of 202.42
Amounts load as text, or as 20242 instead of 202.42
The column was typed with your computer’s locale. Keep the
"en-US" culture argument in Table.TransformColumnTypes, and delete any Changed Type step Power Query added on its own.Excel asks for credentials again on every refresh
Excel asks for credentials again on every refresh
The credentials were saved for a different URL. Open Data → Get Data → Data Source Settings, clear the entry for
server.twicecommerce.com, refresh, and choose Anonymous again.Refresh fails with "The column 'Tax_Rate_2' of the table wasn't found"
Refresh fails with "The column 'Tax_Rate_2' of the table wasn't found"
A step refers to a tax column the new period does not have. Remove tax columns from every typing or renaming step.
Refresh fails with 401 after it worked before
Refresh fails with 401 after it worked before
Someone deleted or replaced the API key. Put the new key in the
TwiceApiKey parameter under Manage Parameters.Related articles
Pull your data into a BI tool
The endpoints, the file format and the rate limits.
Connect Power BI
The same queries, refreshed on a schedule.
Finance reports
Every ledger column, and how each number is derived.