> ## Documentation Index
> Fetch the complete documentation index at: https://www.twicecommerce.com/docs/llms.txt
> Use this file to discover all available pages before exploring further.
# Reports
> Analyze your business across 70+ built-in reports covering sales, orders, customers, finances, and inventory
export const viewAccessDefinition = "Read-only access without ability to make changes.";
export const editAccessDefinition = "Update and read data, but cannot create or delete.";
export const manageAccessDefinition = "Create, update, read, and delete data.";
export const permissionsDefinition = "The actions you are authorized to perform.";
export const visibilityDefinition = "Which features, sections, or data tables are visible to you.";
export const userRoleDefinition = "What a user can see and do. Each user has one built-in system role — Owner, Admin, Manager, or Member — and can also be assigned any number of custom roles you create with specific permissions. Effective access is the combination of all their roles.";
 This view can look different dependent on your user role.
See [Visibility & Permissions](#visibility-and-permissions) for details.
**Advanced reporting** is available on the **Standard** and **Enterprise** plans. See [plans](/docs/twice-commerce-overview#pricing).
reports
## Primary Purpose
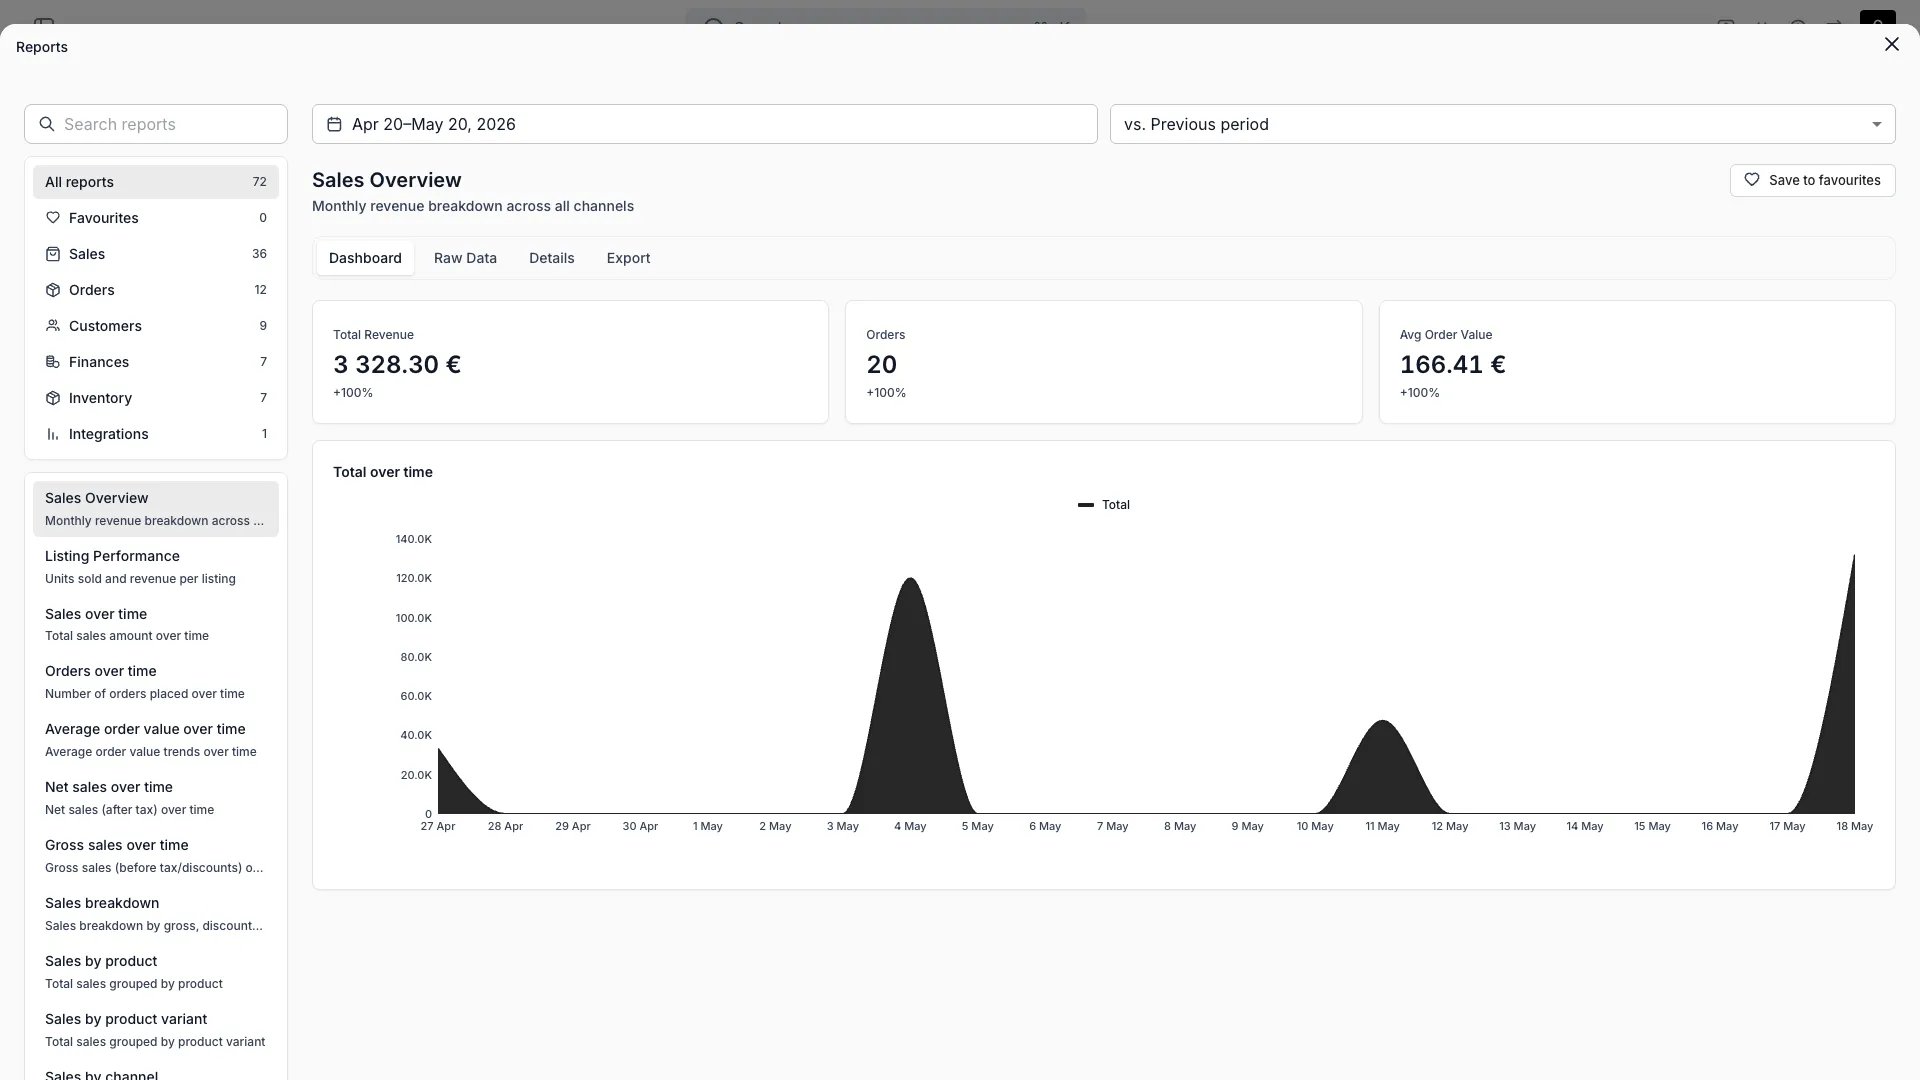
Reports gives you 70+ built-in reports organized across six categories. Each report includes score cards, charts, and a data table you can filter by date range, location, and comparison period.
Track revenue, average order value, gross profit, and sales breakdown by product, location, channel, customer, and currency. Includes dedicated views for subscriptions, bookings, discount codes, and weekly sales patterns.
Monitor order volume over time, fulfilled orders, return rates, and returns by product. View orders grouped by status and purchase type, track average booking duration, and see upcoming returns for proactive inventory planning.
Analyze new customer registrations, returning customer rate, and customer lifetime value. Segment customers by country and location, and compare new versus returning customer sales contribution.
Accrual-basis [Revenue report](/docs/concepts/reports/finance-reports) and cash-basis [Payments report](/docs/concepts/reports/finance-reports#payments-report) with deferred revenue tracking, reconciliation bridge, and CSV export. Also includes payment volumes over time, breakdowns by gateway and method, payment fees, and per-order payment details.
Monitor stock levels by status, inventory value per article, daily items sold, and sell-through rate. Analyze per-article utilization including order count and revenue generated.
View website analytics data from connected third-party sources.
## Report Features
Every report shares a common set of tools for analysis and comparison.
Filter any report by date range using presets (last 7, 30, or 90 days, last week, last month, last year) or a custom range. Compare against the previous period or previous year to spot trends.
Reports display data as line charts, bar charts, horizontal bar charts, or donut charts depending on the metric. Each report also includes a full data table beneath the chart.
Summary metrics appear at the top of each report showing key values (revenue, count, percentage, or duration) with percentage change indicators compared to the selected comparison period.
Search across all your reports by name. Bookmark frequently used reports for quick access from the sidebar.
Filter report data by location to analyze performance across individual stores or warehouses.
## Anatomy of a report
Each report has four sub-views you can switch between.
### Dashboard
The default view: score cards at the top, primary chart, and quick filters. Best for at-a-glance trends and percentage changes.
### Raw data
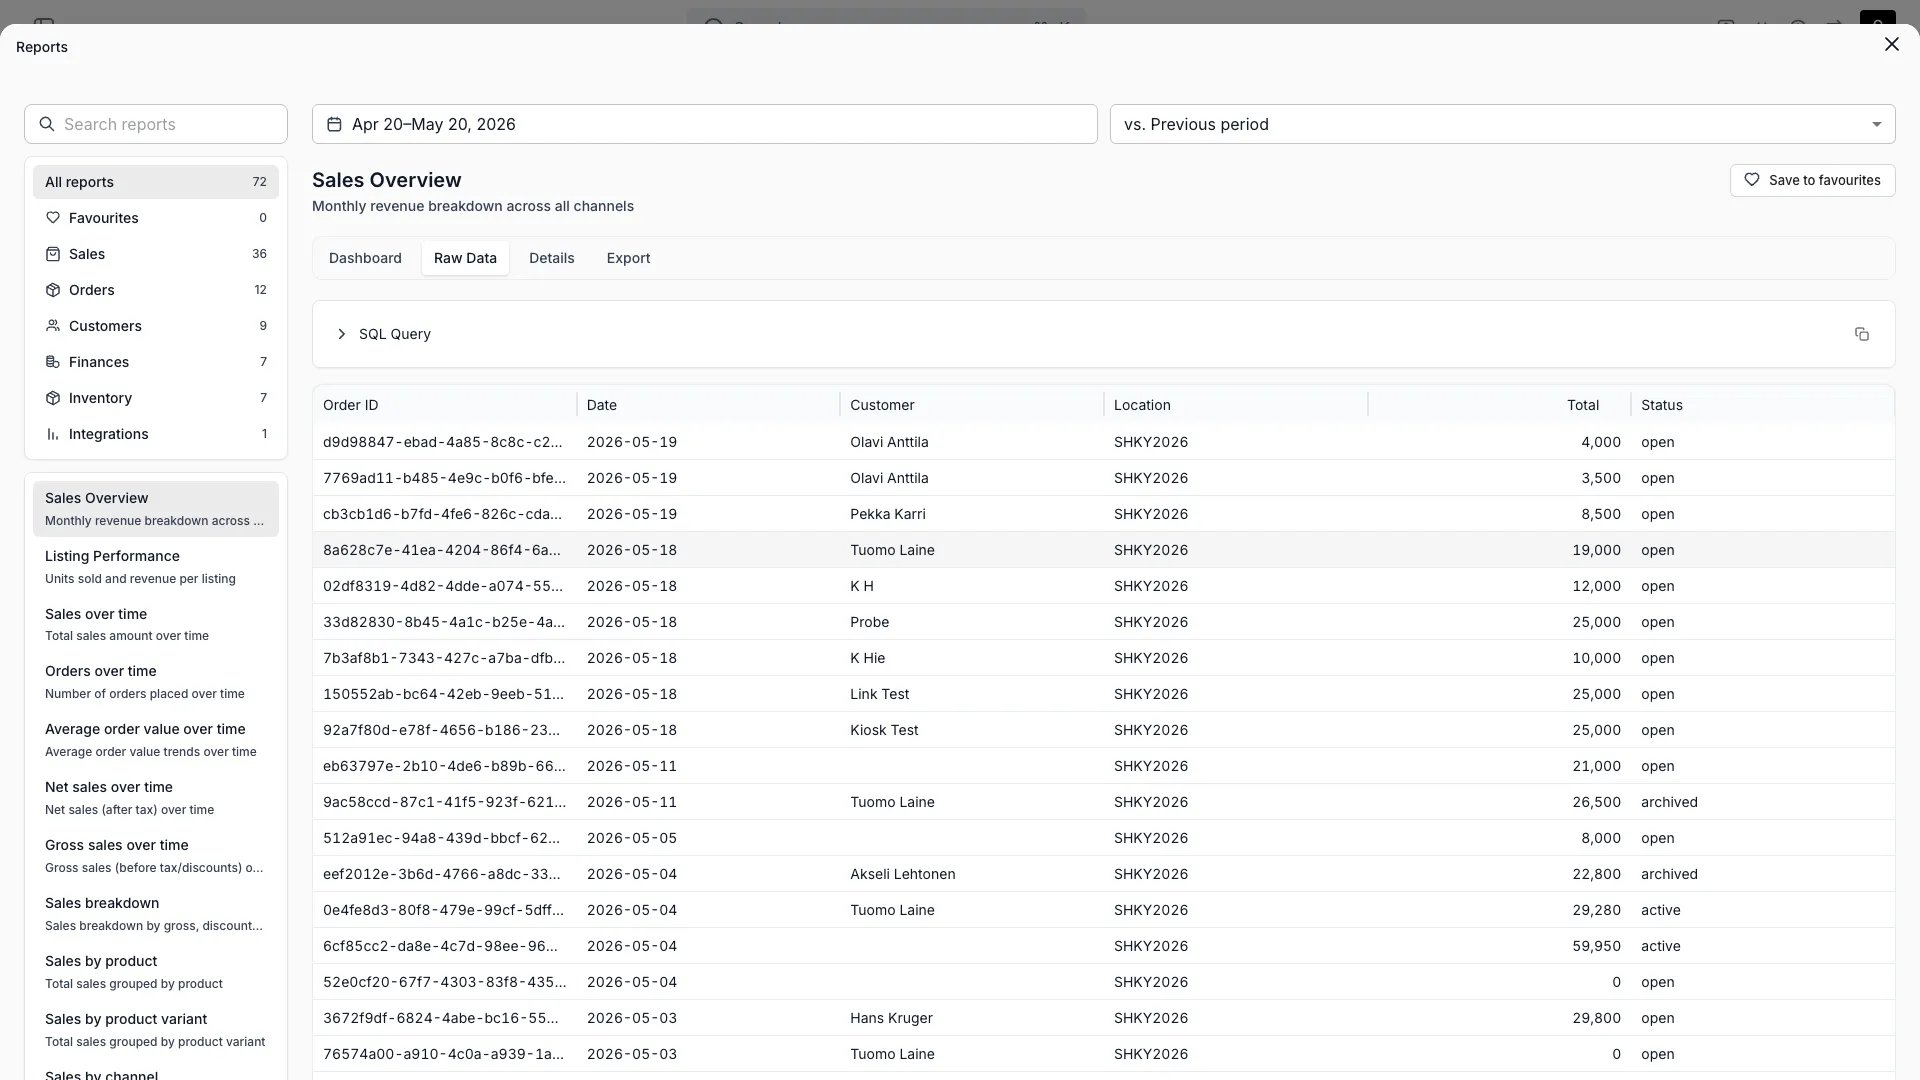
The full data table behind the chart — every row, every column. Sortable, searchable, and filterable.
 ### Details
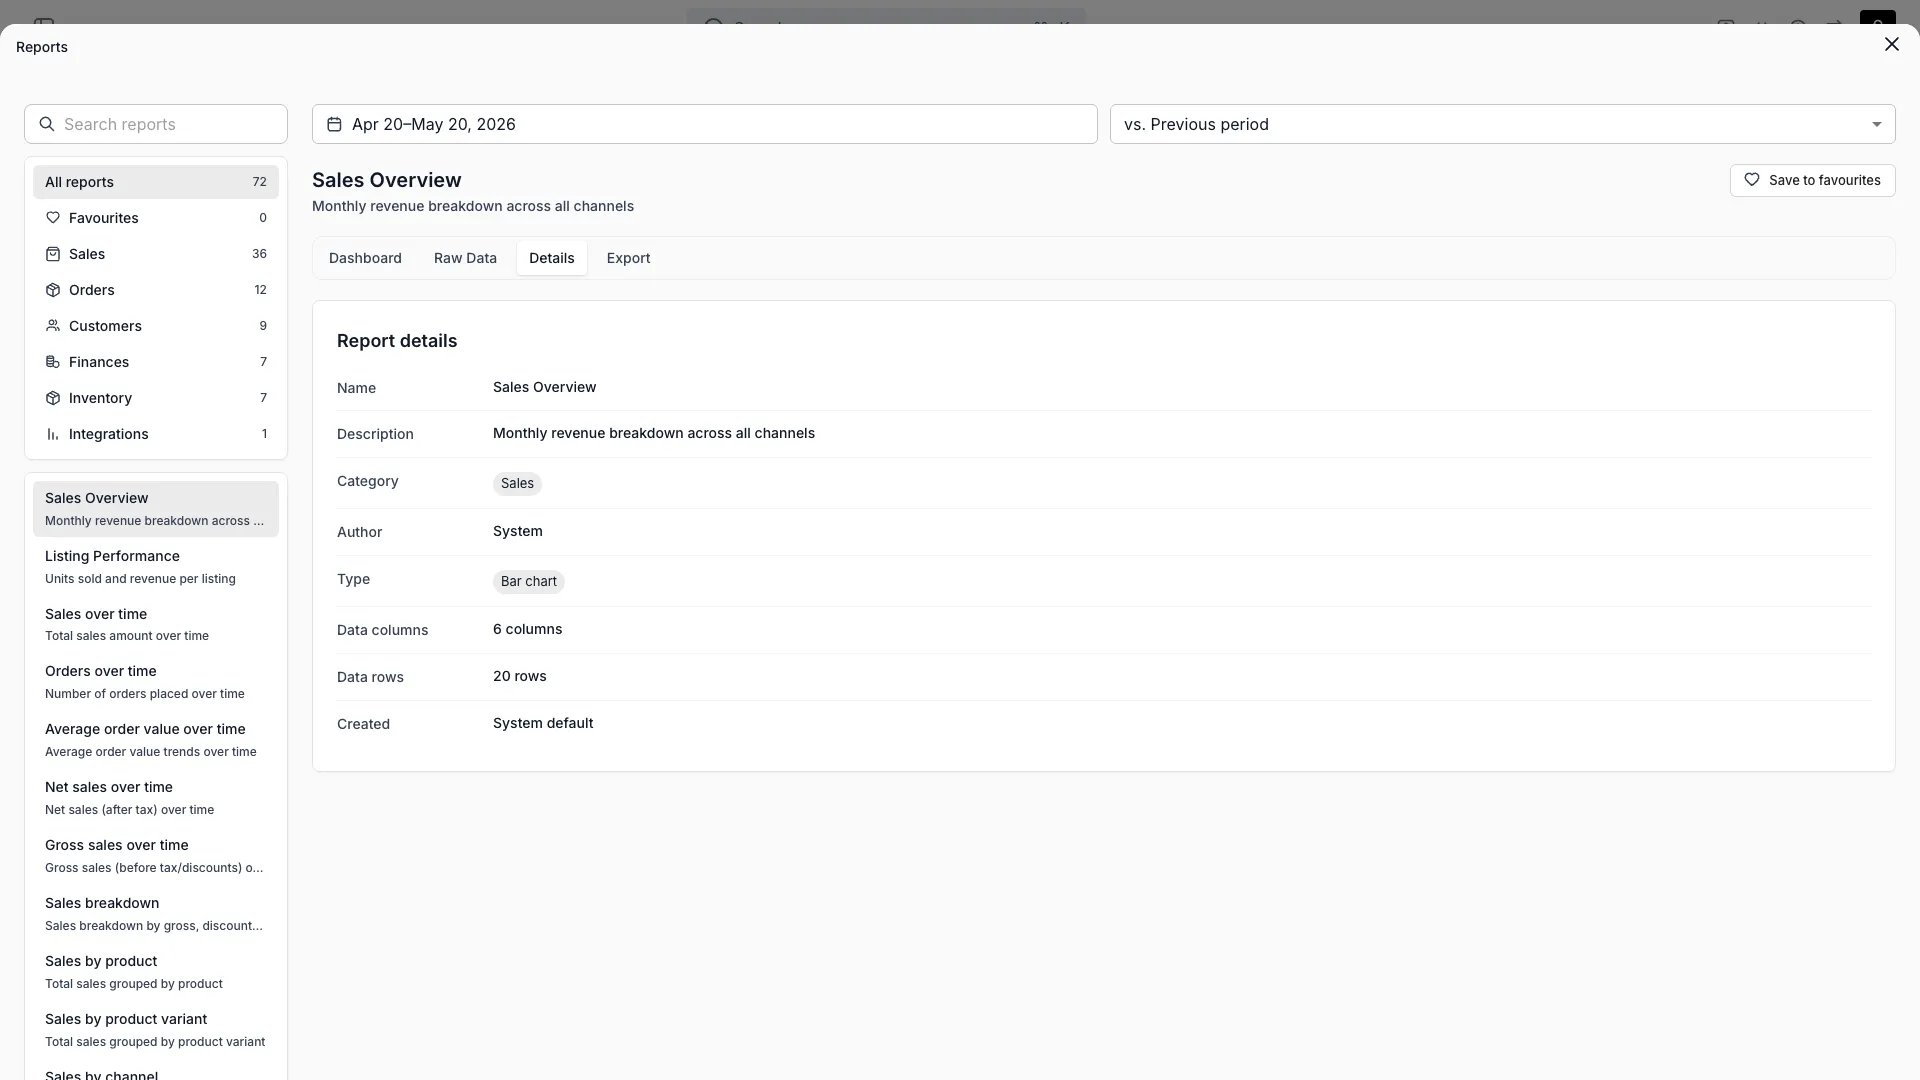
Per-row drill-down showing the records that make up the aggregated values — useful for verifying numbers and finding outliers.
### Details
Per-row drill-down showing the records that make up the aggregated values — useful for verifying numbers and finding outliers.
 ### Export
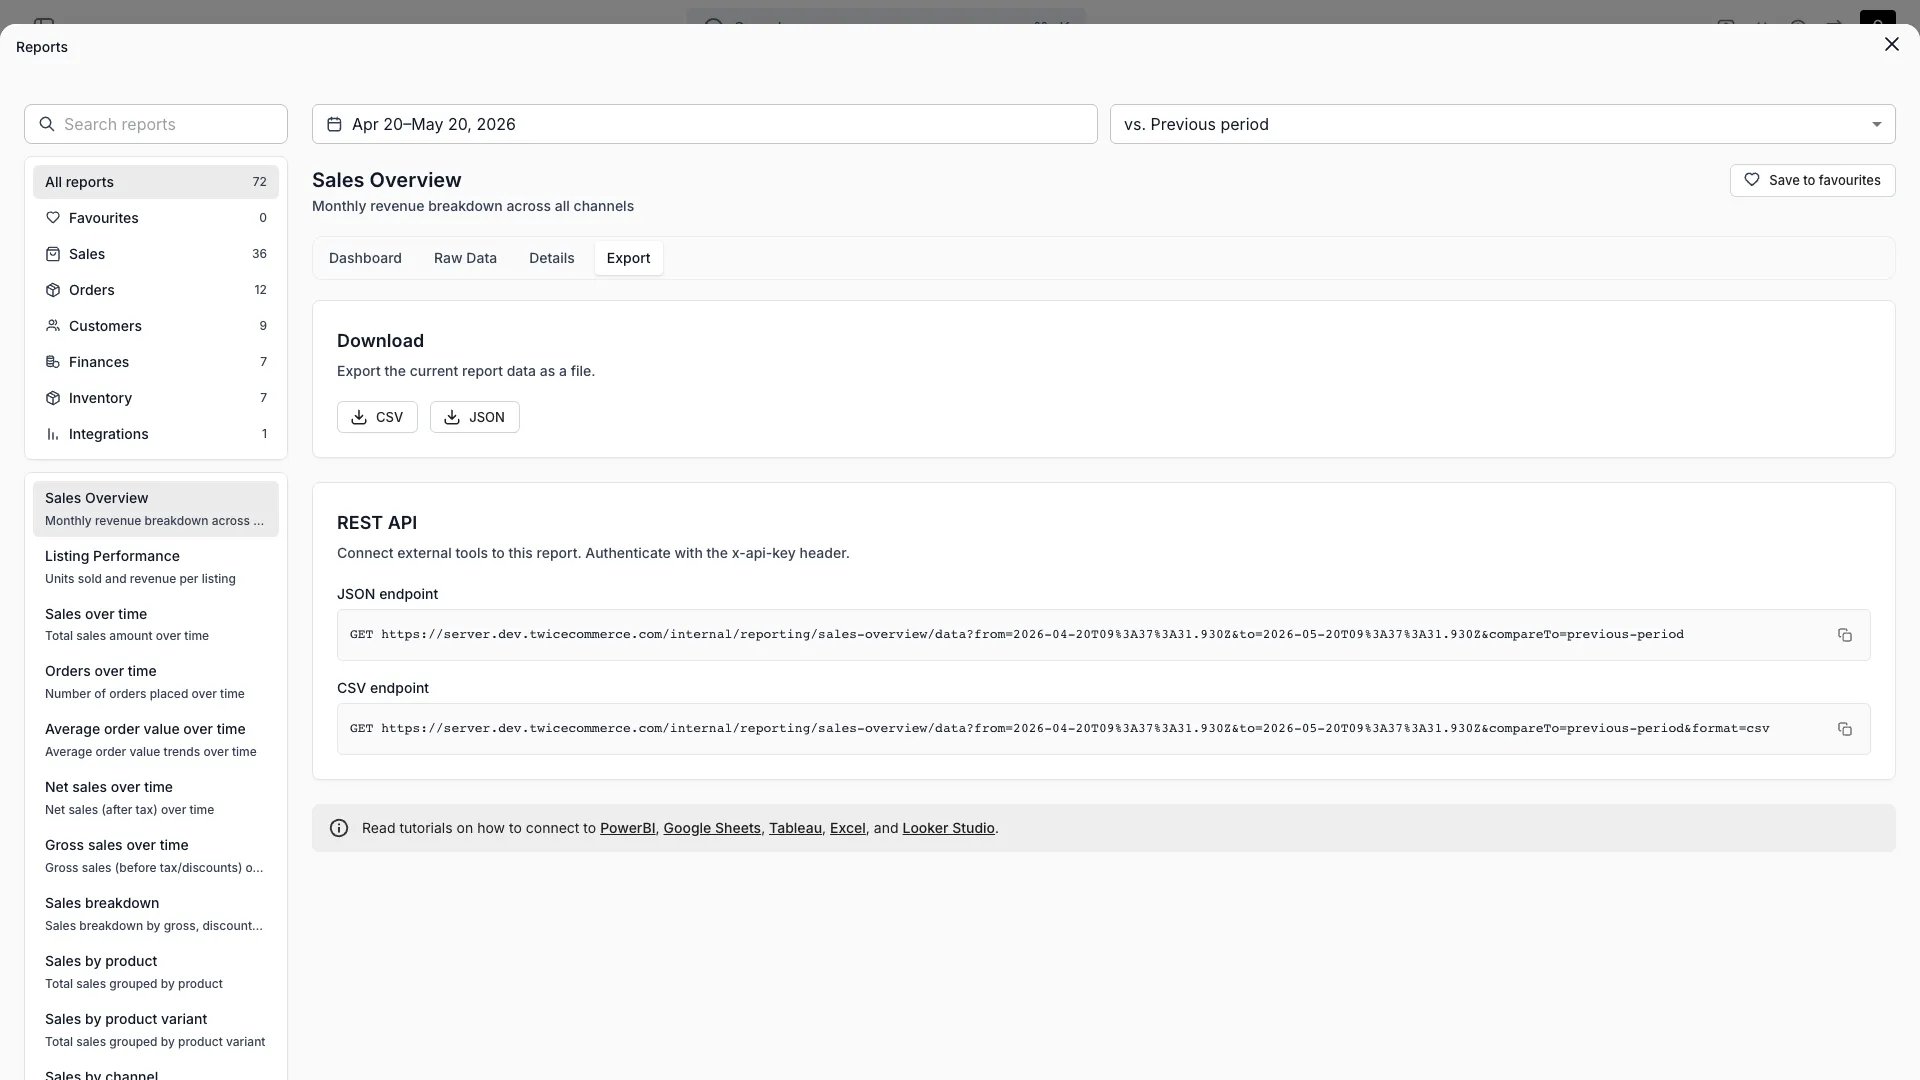
Export the report (current view, with active filters applied) as CSV. Exports can also be scheduled and emailed via [Workflows](/docs/workflows).
### Export
Export the report (current view, with active filters applied) as CSV. Exports can also be scheduled and emailed via [Workflows](/docs/workflows).
 ## Example
Fetch report data from the API by specifying a report ID, date range, and optional comparison period.
```bash cURL theme={null}
curl -X GET "https://server.twicecommerce.com/v1/reports/sales-overview?start=2026-01-01&end=2026-03-31&compare=previous_period" \
-H "Authorization: Bearer {token}" \
-H "Content-Type: application/json"
```
```javascript Node.js theme={null}
const report = await twice.reports.get({
id: 'sales-overview',
start: '2026-01-01',
end: '2026-03-31',
compare: 'previous_period',
});
```
## Related Concepts
Here are a few key concepts of TWICE Commerce that relate to Reports.
Reports are organized into six categories — Sales, Orders, Customers, Finances, Inventory, and Integrations — each covering a different area of your business. The sidebar navigation groups reports by category for quick access.
Every report supports comparing the current date range against a previous period or the same period last year. Score cards show percentage change indicators so you can identify growth or decline at a glance.
Report data is available through the API with all active filters (date range, location, comparison period) applied, so you can integrate report data into external dashboards or workflows.
## Visibility and Permissions
Access to this view is controlled by your user role. Your user role determines both
visibility and
permissions for
manage,
edit, and
view access levels.
| Feature | Admin | Manager | Member |
| ------------------- | ----- | ------- | ------ |
| Sales Reports | ✓ | ✓ | ✗ |
| Order Reports | ✓ | ✓ | ✗ |
| Customer Reports | ✓ | ✓ | ✗ |
| Finance Reports | ✓ | ✗ | ✗ |
| Inventory Reports | ✓ | ✓ | ✓ |
| Integration Reports | ✓ | ✓ | ✗ |
| Resource | Admin | Manager | Member |
| ---------------- | ------ | ------- | ------ |
| View Reports | Manage | Manage | View |
| Export Data | Manage | Edit | View |
| Manage Favorites | Manage | Manage | Manage |
## Related Guides
Revenue and Payments reports — accrual vs cash-basis analysis with reconciliation
Manage all order types in one unified view
Track and manage all stock items in your inventory
## Example
Fetch report data from the API by specifying a report ID, date range, and optional comparison period.
```bash cURL theme={null}
curl -X GET "https://server.twicecommerce.com/v1/reports/sales-overview?start=2026-01-01&end=2026-03-31&compare=previous_period" \
-H "Authorization: Bearer {token}" \
-H "Content-Type: application/json"
```
```javascript Node.js theme={null}
const report = await twice.reports.get({
id: 'sales-overview',
start: '2026-01-01',
end: '2026-03-31',
compare: 'previous_period',
});
```
## Related Concepts
Here are a few key concepts of TWICE Commerce that relate to Reports.
Reports are organized into six categories — Sales, Orders, Customers, Finances, Inventory, and Integrations — each covering a different area of your business. The sidebar navigation groups reports by category for quick access.
Every report supports comparing the current date range against a previous period or the same period last year. Score cards show percentage change indicators so you can identify growth or decline at a glance.
Report data is available through the API with all active filters (date range, location, comparison period) applied, so you can integrate report data into external dashboards or workflows.
## Visibility and Permissions
Access to this view is controlled by your user role. Your user role determines both
visibility and
permissions for
manage,
edit, and
view access levels.
| Feature | Admin | Manager | Member |
| ------------------- | ----- | ------- | ------ |
| Sales Reports | ✓ | ✓ | ✗ |
| Order Reports | ✓ | ✓ | ✗ |
| Customer Reports | ✓ | ✓ | ✗ |
| Finance Reports | ✓ | ✗ | ✗ |
| Inventory Reports | ✓ | ✓ | ✓ |
| Integration Reports | ✓ | ✓ | ✗ |
| Resource | Admin | Manager | Member |
| ---------------- | ------ | ------- | ------ |
| View Reports | Manage | Manage | View |
| Export Data | Manage | Edit | View |
| Manage Favorites | Manage | Manage | Manage |
## Related Guides
Revenue and Payments reports — accrual vs cash-basis analysis with reconciliation
Manage all order types in one unified view
Track and manage all stock items in your inventory