> ## Documentation Index
> Fetch the complete documentation index at: https://www.twicecommerce.com/docs/llms.txt
> Use this file to discover all available pages before exploring further.
# How to connect Tableau to TWICE Commerce
> Build Tableau workbooks on your TWICE Commerce revenue and payments data, loaded through a Google Sheet that refreshes on a timer.
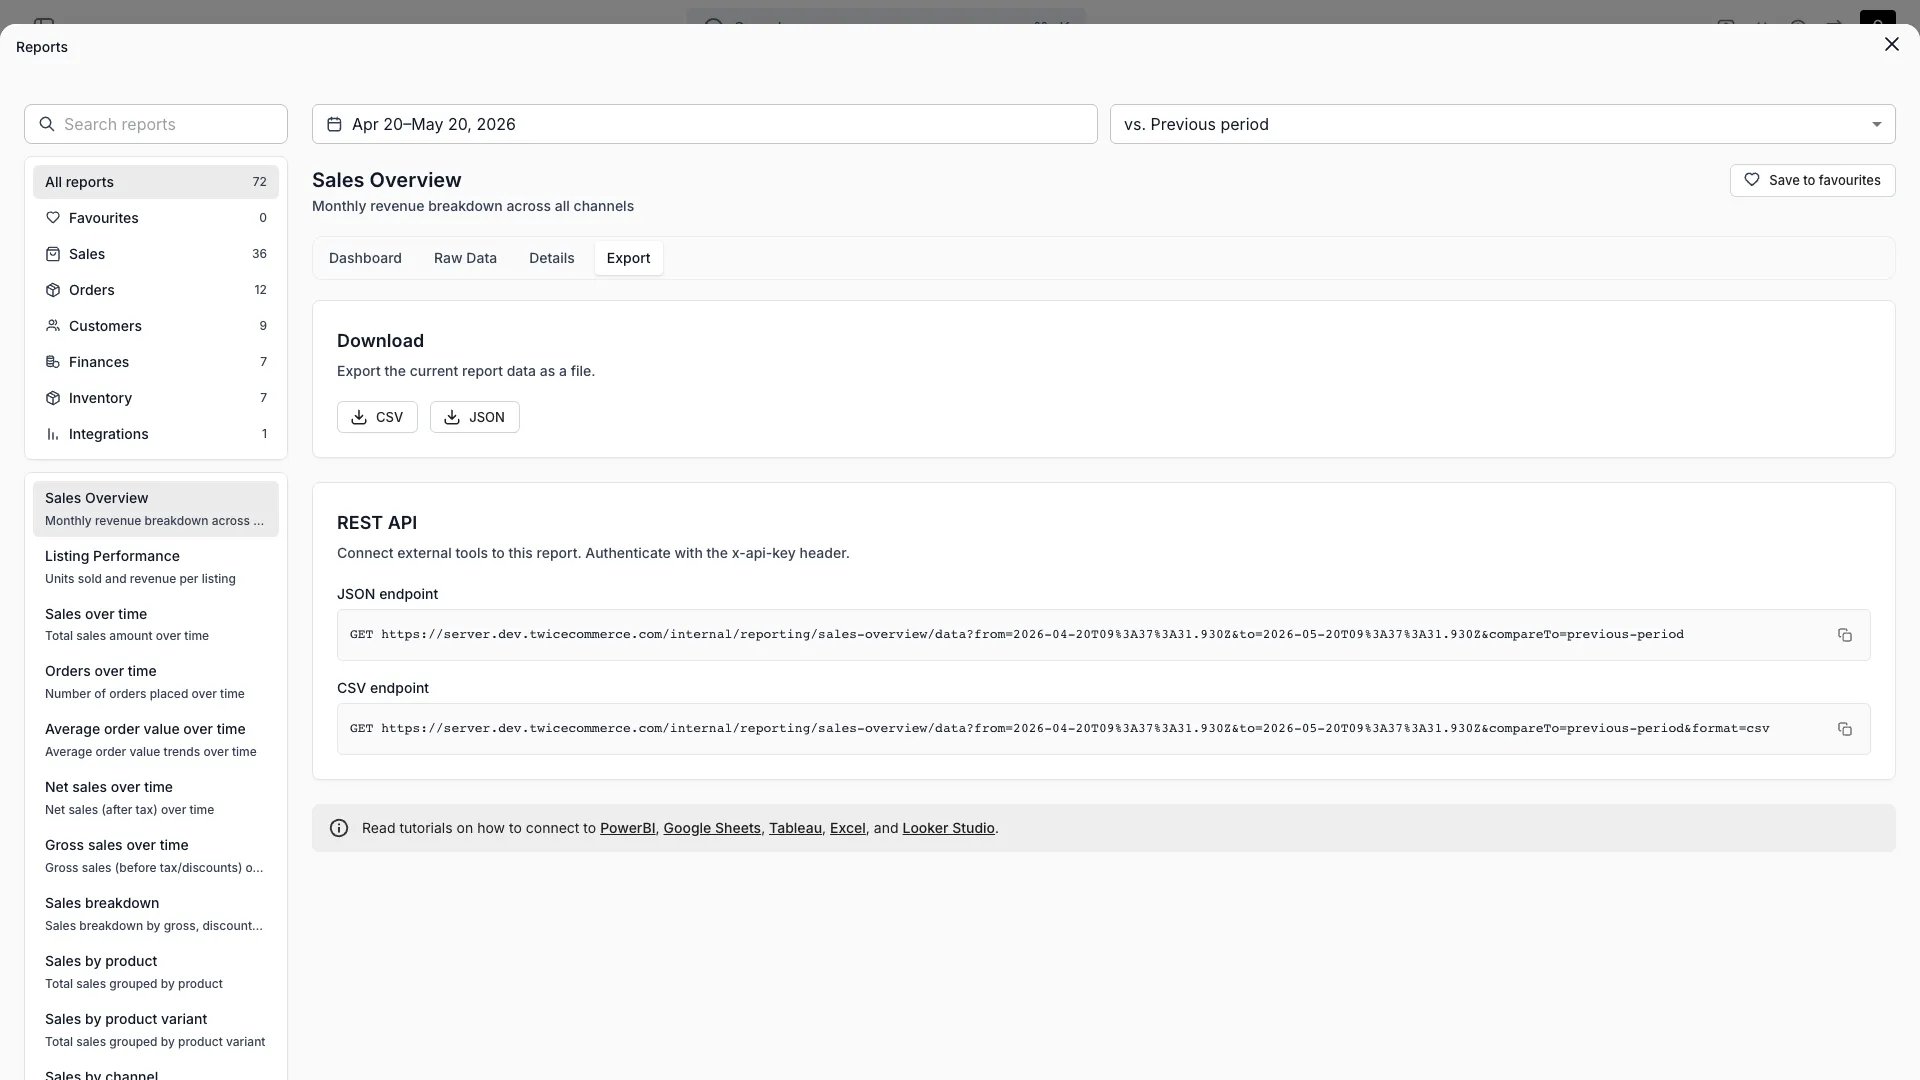 reports
Load the ledgers into a Google Sheet, then connect Tableau to the sheet with its Google Drive connector. Tableau has no built-in connector that sends an API key header, so the sheet is the bridge, and Tableau Cloud refreshes from it on a schedule.
## Prerequisites
**Required access:** a TWICE Commerce API key, used by the Google Sheet. Anyone who can edit the sheet can read the key, so give Tableau viewers access to the workbook only. See [API keys](/docs/concepts/integrations/api-keys).
**Before you start:**
* **The sheet.** Set it up in [Connect Google Sheets](/docs/guides/reports/connect-google-sheets) and let the script run once.
* **Tableau Desktop**, and Tableau Cloud or Tableau Server if you want scheduled refresh.
## The walkthrough
In Tableau Desktop, choose **Connect → To a Server → Google Drive**, sign in with the Google account that owns the sheet, and select the spreadsheet.
Drag the `Revenue` tab to the canvas, then drag `Payments` next to it. Set the relationship to `Row_ID` (Revenue) = `Revenue_Row_ID` (Payments).
Set `Create_Date`, `Start_Date`, `End_Date` and `Payment_Date` to **Date**, and every `Amount_` field to **Number (decimal)**. Set `Row_ID` and `Order_ID` to **String**.
Choose **Server → Publish Data Source**, keep the data source as an extract, and embed the Google credentials so the refresh can run without you.
Open the published data source in Tableau Cloud, go to its **Extract Refreshes** tab, choose **New Extract Refresh**, and pick a time after the sheet's own trigger has run.
For a one-off analysis, skip the sheet: save the ledger with the cURL call in [Pull your data into a BI tool](/docs/guides/reports/pull-report-data) and open it under **Connect → Text file**, with the field separator set to semicolon.
## How do I know it worked?
* A sheet summing `Amount_Total`, filtered to `Started_In_Period` = `Yes`, matches the **Revenue report** in the admin for the same period and currency.
* The data source's refresh history in Tableau Cloud shows a completed scheduled refresh.
## Troubleshooting / common pitfalls
The embedded Google credentials expired or belong to someone who lost access to the sheet. Edit the data source's connection in Tableau Cloud and sign in again with an account that can open the sheet.
Tableau refreshed before the sheet did. Move the extract refresh to at least an hour after the sheet's Apps Script trigger.
The tax columns follow the tax rates in the period, so `Tax_Rate_2` can come and go. Build views on `Amount_Excl_Tax` and `Amount_Total`.
Tableau documents the connector in [Google Drive](https://help.tableau.com/current/pro/desktop/en-us/examples_googledrive.htm).
## Related articles
The sheet this workbook reads.
The endpoints, the file format and the data model.
Every ledger column, and how each number is derived.
reports
Load the ledgers into a Google Sheet, then connect Tableau to the sheet with its Google Drive connector. Tableau has no built-in connector that sends an API key header, so the sheet is the bridge, and Tableau Cloud refreshes from it on a schedule.
## Prerequisites
**Required access:** a TWICE Commerce API key, used by the Google Sheet. Anyone who can edit the sheet can read the key, so give Tableau viewers access to the workbook only. See [API keys](/docs/concepts/integrations/api-keys).
**Before you start:**
* **The sheet.** Set it up in [Connect Google Sheets](/docs/guides/reports/connect-google-sheets) and let the script run once.
* **Tableau Desktop**, and Tableau Cloud or Tableau Server if you want scheduled refresh.
## The walkthrough
In Tableau Desktop, choose **Connect → To a Server → Google Drive**, sign in with the Google account that owns the sheet, and select the spreadsheet.
Drag the `Revenue` tab to the canvas, then drag `Payments` next to it. Set the relationship to `Row_ID` (Revenue) = `Revenue_Row_ID` (Payments).
Set `Create_Date`, `Start_Date`, `End_Date` and `Payment_Date` to **Date**, and every `Amount_` field to **Number (decimal)**. Set `Row_ID` and `Order_ID` to **String**.
Choose **Server → Publish Data Source**, keep the data source as an extract, and embed the Google credentials so the refresh can run without you.
Open the published data source in Tableau Cloud, go to its **Extract Refreshes** tab, choose **New Extract Refresh**, and pick a time after the sheet's own trigger has run.
For a one-off analysis, skip the sheet: save the ledger with the cURL call in [Pull your data into a BI tool](/docs/guides/reports/pull-report-data) and open it under **Connect → Text file**, with the field separator set to semicolon.
## How do I know it worked?
* A sheet summing `Amount_Total`, filtered to `Started_In_Period` = `Yes`, matches the **Revenue report** in the admin for the same period and currency.
* The data source's refresh history in Tableau Cloud shows a completed scheduled refresh.
## Troubleshooting / common pitfalls
The embedded Google credentials expired or belong to someone who lost access to the sheet. Edit the data source's connection in Tableau Cloud and sign in again with an account that can open the sheet.
Tableau refreshed before the sheet did. Move the extract refresh to at least an hour after the sheet's Apps Script trigger.
The tax columns follow the tax rates in the period, so `Tax_Rate_2` can come and go. Build views on `Amount_Excl_Tax` and `Amount_Total`.
Tableau documents the connector in [Google Drive](https://help.tableau.com/current/pro/desktop/en-us/examples_googledrive.htm).
## Related articles
The sheet this workbook reads.
The endpoints, the file format and the data model.
Every ledger column, and how each number is derived.