> ## Documentation Index
> Fetch the complete documentation index at: https://www.twicecommerce.com/docs/llms.txt
> Use this file to discover all available pages before exploring further.
# How to connect Power BI to TWICE Commerce
> Load the revenue and payments ledgers into Power BI with the API key in a header, build your own model on them, and refresh it on a schedule in the Power BI service.
 reports
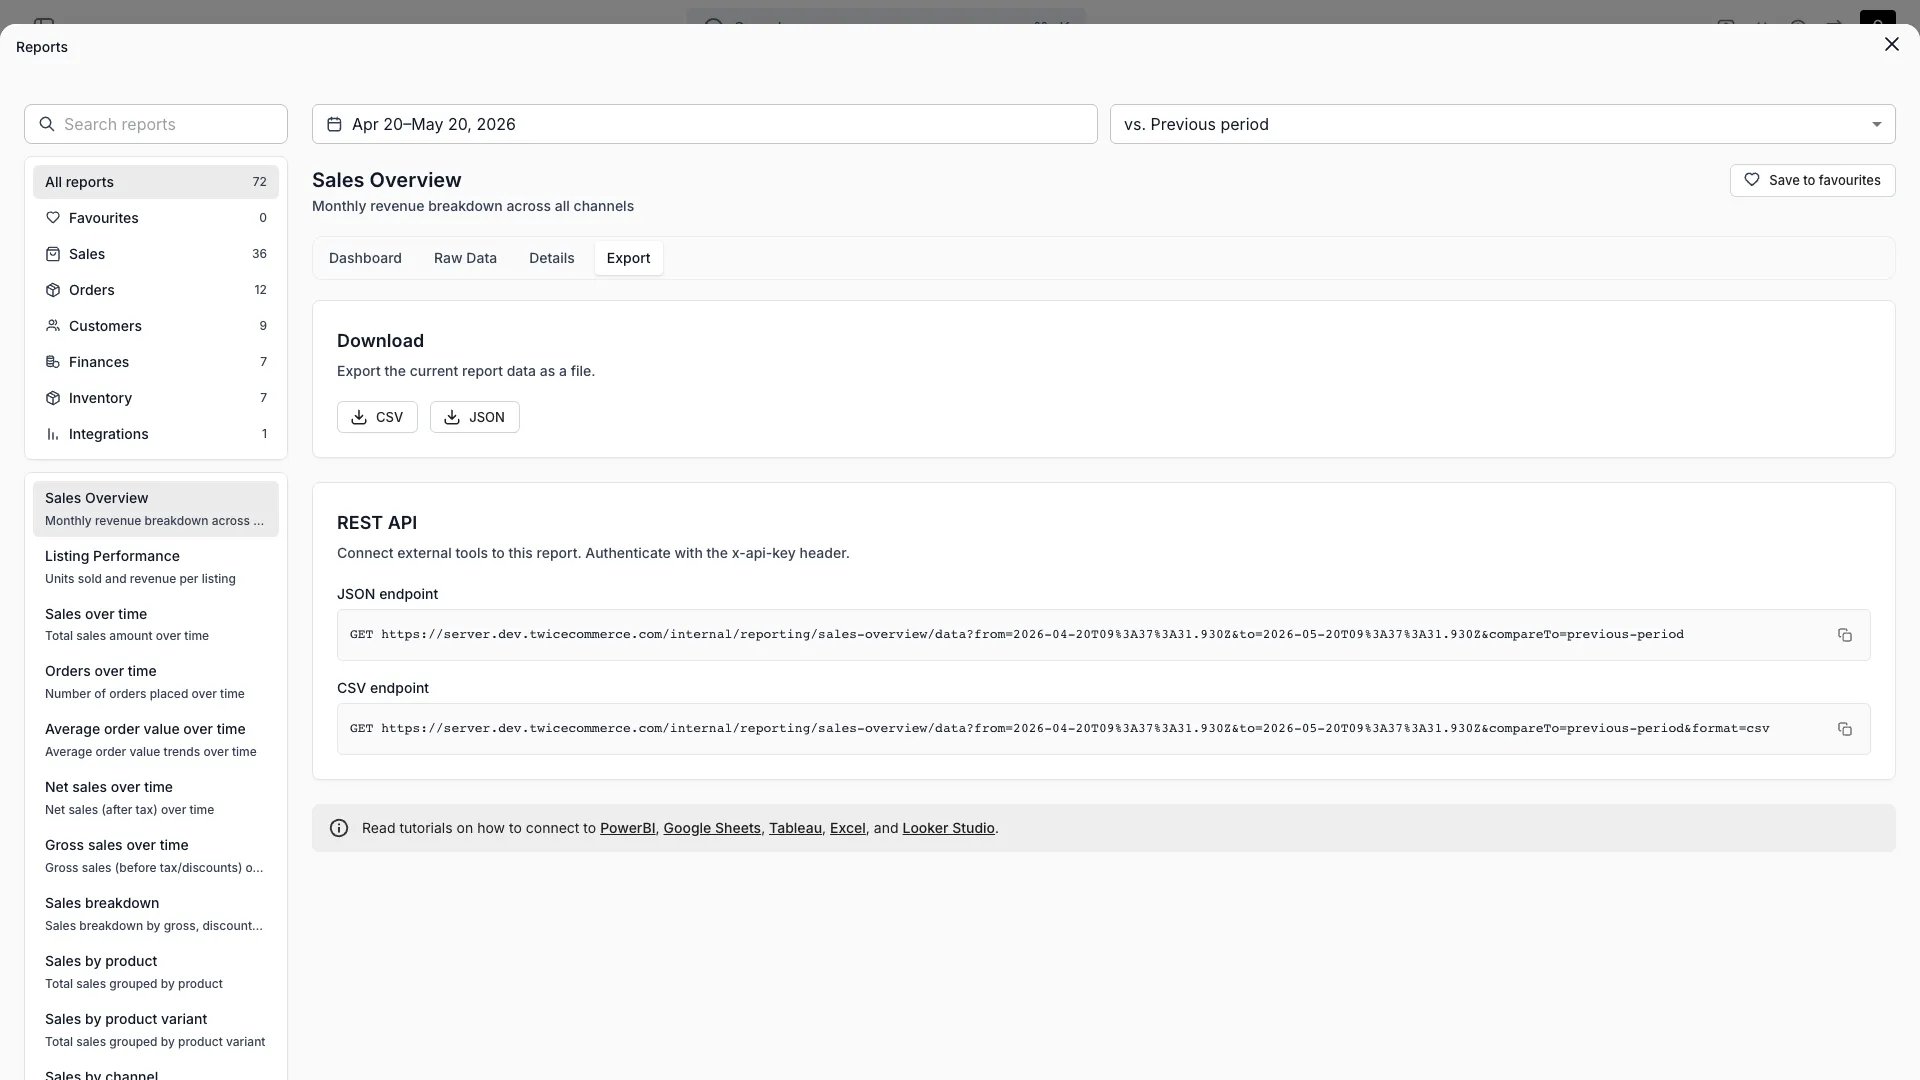
Load the revenue and payments ledgers into Power BI as two queries, relate them, and build your own report pages on the rows. Power BI then refreshes the data from TWICE Commerce on the schedule you set.
## Prerequisites
**Required access:** a TWICE Commerce API key. It carries owner-level permissions and sits in the Power BI file, so share the file only with people you would give the key to. See [API keys](/docs/concepts/integrations/api-keys).
**Before you start:**
* **Power BI Desktop**, and a Power BI service workspace if you want scheduled refresh.
* **The ledger endpoints and file format** from [Pull your data into a BI tool](/docs/guides/reports/pull-report-data). This guide uses them without repeating them.
* **Your currency code** and the first date you want history from.
## The walkthrough
Open Power BI Desktop and select **Transform data** to open the Power Query editor. Choose **Manage Parameters → New Parameter**, name it `TwiceApiKey`, set **Type** to **Text**, and paste the key into **Current Value**.
Choose **New Source → Blank Query**, open **Advanced Editor**, and replace its contents with the query below. Change `currency` and `FromDate` to yours. Rename the query `Revenue`.
The fixed base URL with `RelativePath` and `Query` is what lets the Power BI service refresh the query. A URL assembled as one string refreshes in Desktop and fails in the service.
Choose **Edit Credentials** when Power Query asks how to connect, pick **Anonymous**, and select **Connect**. The key travels in the header, so no other sign-in applies.
Duplicate the `Revenue` query, rename the copy `Payments`, and change `RelativePath` to `internal/reporting/payments/export`. Replace the typed columns with `Payment_Date` as `type date` and `Amount_Total` as `type number`.
Select **Close & Apply**, then open the **Model** view. Drag `Payments[Revenue_Row_ID]` onto `Revenue[Row_ID]` to create a many-to-one relationship.
Publish the report to a workspace. In the service, open the semantic model's **Settings**, go to **Data source credentials**, select **Edit credentials**, and choose **Anonymous** with the privacy level **Organizational**. Tick **Skip test connection** if the dialog offers it.
Turn on **Scheduled refresh** in the same settings and add the times you want. The source is on the public internet, so no gateway is needed.
Use this query for the revenue ledger:
```powerquery Revenue theme={null}
let
FromDate = "2025-01-01",
ToDate = Date.ToText(Date.From(DateTime.LocalNow()), "yyyy-MM-dd"),
Source = Web.Contents(
"https://server.twicecommerce.com",
[
RelativePath = "internal/reporting/revenue/export",
Query = [from = FromDate, to = ToDate, currency = "EUR"],
Headers = [#"X-API-KEY" = TwiceApiKey]
]
),
Csv = Csv.Document(Source, [Delimiter = ";", Encoding = 65001, QuoteStyle = QuoteStyle.Csv]),
Promoted = Table.PromoteHeaders(Csv, [PromoteAllScalars = true]),
// A truncated export ends in a notice row with no Row_ID. Drop it.
DataRows = Table.SelectRows(Promoted, each [Row_ID] <> null and [Row_ID] <> ""),
Typed = Table.TransformColumnTypes(
DataRows,
{
{"Create_Date", type date}, {"Start_Date", type date}, {"End_Date", type date},
{"Quantity", type number}, {"Amount_Excl_Tax", type number},
{"Amount_Total", type number}, {"Amount_Paid", type number},
{"Amount_Refunded", type number}, {"Amount_Outstanding", type number}
},
"en-US"
)
in
Typed
```
The `"en-US"` culture reads `202.42` as a number on a computer set to a comma-decimal locale, such as Finnish. The tax columns are left untyped, because their number follows the tax rates in the period.
## Load more than 100,000 rows
Split the history into one call per year and append the results. Keep it to five years or fewer per refresh, the export rate limit described in [Pull your data into a BI tool](/docs/guides/reports/pull-report-data#stay-inside-the-rate-limits).
```powerquery Revenue (one call per year) theme={null}
let
Years = {2024, 2025, 2026},
GetYear = (year as number) =>
let
Source = Web.Contents(
"https://server.twicecommerce.com",
[
RelativePath = "internal/reporting/revenue/export",
Query = [from = Text.From(year) & "-01-01", to = Text.From(year) & "-12-31", currency = "EUR"],
Headers = [#"X-API-KEY" = TwiceApiKey]
]
),
Csv = Csv.Document(Source, [Delimiter = ";", Encoding = 65001, QuoteStyle = QuoteStyle.Csv])
in
Table.PromoteHeaders(Csv, [PromoteAllScalars = true]),
Combined = Table.Combine(List.Transform(Years, GetYear)),
DataRows = Table.SelectRows(Combined, each [Row_ID] <> null and [Row_ID] <> "")
in
DataRows
```
Add the `Typed` step from the first query to the end of this one.
## How do I know it worked?
* The `Revenue` table shows one row per order line, and `Amount_Total` is a number column.
* A card summing `Amount_Total` filtered to `Started_In_Period = "Yes"` matches the **Revenue report** in the admin for the same period and currency.
* The semantic model's **Refresh history** in the service shows a completed scheduled refresh.
## Troubleshooting / common pitfalls
The query builds its URL as one string. Rewrite it with the fixed base URL and the `RelativePath` and `Query` options, as in the query above, and publish again.
The column was typed with your computer's locale. Keep the `"en-US"` culture argument in `Table.TransformColumnTypes`, and delete any **Changed Type** step Power Query added on its own.
A step refers to a tax column the new period does not have. Remove tax columns from every typing or renaming step, and type them in the report layer if you need them.
The refresh made more than five export calls in one minute. Cut the number of yearly calls, or schedule the `Revenue` and `Payments` models apart.
Someone deleted or replaced the API key. Put the new key in the `TwiceApiKey` parameter, in Desktop or under the semantic model's **Parameters** in the service.
Microsoft documents the Web connector and scheduled refresh in its [Power Query Web connector](https://learn.microsoft.com/en-us/power-query/connectors/web/web) and [Configure scheduled refresh](https://learn.microsoft.com/en-us/power-bi/connect-data/refresh-scheduled-refresh) articles.
## Related articles
The endpoints, the file format and the rate limits.
The same queries in Excel's Power Query.
Every ledger column, and how each number is derived.
Creating and deleting keys.
reports
Load the revenue and payments ledgers into Power BI as two queries, relate them, and build your own report pages on the rows. Power BI then refreshes the data from TWICE Commerce on the schedule you set.
## Prerequisites
**Required access:** a TWICE Commerce API key. It carries owner-level permissions and sits in the Power BI file, so share the file only with people you would give the key to. See [API keys](/docs/concepts/integrations/api-keys).
**Before you start:**
* **Power BI Desktop**, and a Power BI service workspace if you want scheduled refresh.
* **The ledger endpoints and file format** from [Pull your data into a BI tool](/docs/guides/reports/pull-report-data). This guide uses them without repeating them.
* **Your currency code** and the first date you want history from.
## The walkthrough
Open Power BI Desktop and select **Transform data** to open the Power Query editor. Choose **Manage Parameters → New Parameter**, name it `TwiceApiKey`, set **Type** to **Text**, and paste the key into **Current Value**.
Choose **New Source → Blank Query**, open **Advanced Editor**, and replace its contents with the query below. Change `currency` and `FromDate` to yours. Rename the query `Revenue`.
The fixed base URL with `RelativePath` and `Query` is what lets the Power BI service refresh the query. A URL assembled as one string refreshes in Desktop and fails in the service.
Choose **Edit Credentials** when Power Query asks how to connect, pick **Anonymous**, and select **Connect**. The key travels in the header, so no other sign-in applies.
Duplicate the `Revenue` query, rename the copy `Payments`, and change `RelativePath` to `internal/reporting/payments/export`. Replace the typed columns with `Payment_Date` as `type date` and `Amount_Total` as `type number`.
Select **Close & Apply**, then open the **Model** view. Drag `Payments[Revenue_Row_ID]` onto `Revenue[Row_ID]` to create a many-to-one relationship.
Publish the report to a workspace. In the service, open the semantic model's **Settings**, go to **Data source credentials**, select **Edit credentials**, and choose **Anonymous** with the privacy level **Organizational**. Tick **Skip test connection** if the dialog offers it.
Turn on **Scheduled refresh** in the same settings and add the times you want. The source is on the public internet, so no gateway is needed.
Use this query for the revenue ledger:
```powerquery Revenue theme={null}
let
FromDate = "2025-01-01",
ToDate = Date.ToText(Date.From(DateTime.LocalNow()), "yyyy-MM-dd"),
Source = Web.Contents(
"https://server.twicecommerce.com",
[
RelativePath = "internal/reporting/revenue/export",
Query = [from = FromDate, to = ToDate, currency = "EUR"],
Headers = [#"X-API-KEY" = TwiceApiKey]
]
),
Csv = Csv.Document(Source, [Delimiter = ";", Encoding = 65001, QuoteStyle = QuoteStyle.Csv]),
Promoted = Table.PromoteHeaders(Csv, [PromoteAllScalars = true]),
// A truncated export ends in a notice row with no Row_ID. Drop it.
DataRows = Table.SelectRows(Promoted, each [Row_ID] <> null and [Row_ID] <> ""),
Typed = Table.TransformColumnTypes(
DataRows,
{
{"Create_Date", type date}, {"Start_Date", type date}, {"End_Date", type date},
{"Quantity", type number}, {"Amount_Excl_Tax", type number},
{"Amount_Total", type number}, {"Amount_Paid", type number},
{"Amount_Refunded", type number}, {"Amount_Outstanding", type number}
},
"en-US"
)
in
Typed
```
The `"en-US"` culture reads `202.42` as a number on a computer set to a comma-decimal locale, such as Finnish. The tax columns are left untyped, because their number follows the tax rates in the period.
## Load more than 100,000 rows
Split the history into one call per year and append the results. Keep it to five years or fewer per refresh, the export rate limit described in [Pull your data into a BI tool](/docs/guides/reports/pull-report-data#stay-inside-the-rate-limits).
```powerquery Revenue (one call per year) theme={null}
let
Years = {2024, 2025, 2026},
GetYear = (year as number) =>
let
Source = Web.Contents(
"https://server.twicecommerce.com",
[
RelativePath = "internal/reporting/revenue/export",
Query = [from = Text.From(year) & "-01-01", to = Text.From(year) & "-12-31", currency = "EUR"],
Headers = [#"X-API-KEY" = TwiceApiKey]
]
),
Csv = Csv.Document(Source, [Delimiter = ";", Encoding = 65001, QuoteStyle = QuoteStyle.Csv])
in
Table.PromoteHeaders(Csv, [PromoteAllScalars = true]),
Combined = Table.Combine(List.Transform(Years, GetYear)),
DataRows = Table.SelectRows(Combined, each [Row_ID] <> null and [Row_ID] <> "")
in
DataRows
```
Add the `Typed` step from the first query to the end of this one.
## How do I know it worked?
* The `Revenue` table shows one row per order line, and `Amount_Total` is a number column.
* A card summing `Amount_Total` filtered to `Started_In_Period = "Yes"` matches the **Revenue report** in the admin for the same period and currency.
* The semantic model's **Refresh history** in the service shows a completed scheduled refresh.
## Troubleshooting / common pitfalls
The query builds its URL as one string. Rewrite it with the fixed base URL and the `RelativePath` and `Query` options, as in the query above, and publish again.
The column was typed with your computer's locale. Keep the `"en-US"` culture argument in `Table.TransformColumnTypes`, and delete any **Changed Type** step Power Query added on its own.
A step refers to a tax column the new period does not have. Remove tax columns from every typing or renaming step, and type them in the report layer if you need them.
The refresh made more than five export calls in one minute. Cut the number of yearly calls, or schedule the `Revenue` and `Payments` models apart.
Someone deleted or replaced the API key. Put the new key in the `TwiceApiKey` parameter, in Desktop or under the semantic model's **Parameters** in the service.
Microsoft documents the Web connector and scheduled refresh in its [Power Query Web connector](https://learn.microsoft.com/en-us/power-query/connectors/web/web) and [Configure scheduled refresh](https://learn.microsoft.com/en-us/power-bi/connect-data/refresh-scheduled-refresh) articles.
## Related articles
The endpoints, the file format and the rate limits.
The same queries in Excel's Power Query.
Every ledger column, and how each number is derived.
Creating and deleting keys.